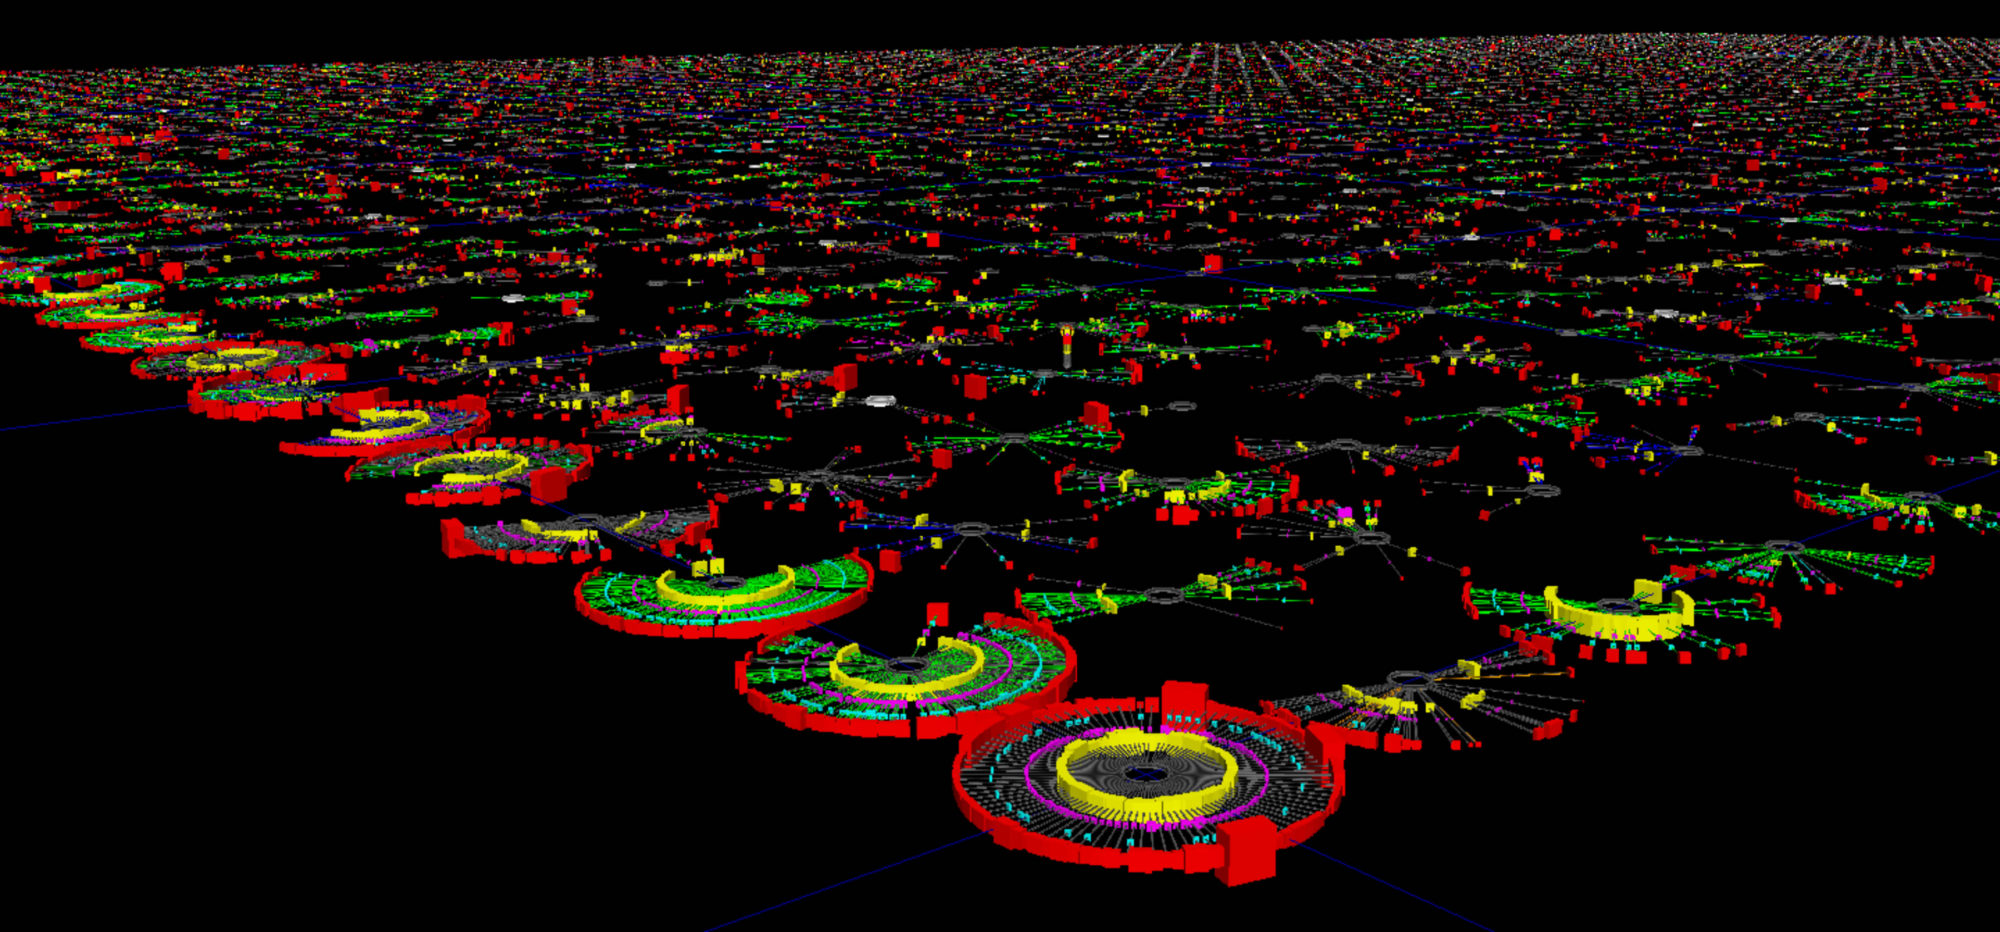
GlyphViz renders structured data — node hierarchies, time series, gene networks, EEG signal fields, strange attractors — as navigable 3D scenes. It is built in the lineage of ANTz, extending its node/tag model into a modern Python toolkit while preserving exact rendering fidelity with the original.

GlyphViz is not a charting library. It treats data structure as scene structure — hierarchy becomes spatial nesting, relationships become topology, and dimensions beyond the third are recovered through projective geometry rather than discarded.
GlyphViz Web is a full browser implementation: open the link, drag in a node CSV, and you’re in a live scene — nothing to download, nothing to install. It’s a from-scratch WebGL rewrite (Three.js), not a stripped-down port, reading the same native gv_ scene format as desktop, and it has closed most of the gap with the desktop app — node creation and editing, selection, tags, Channels animation, color palettes, even cross-eye stereo 3D all work in-browser today.
GlyphVizWeb also supports immersive virtual reality (VR) with the Meta Quest 3 headset, still a work-in-progress but very exciting.