Interactive Plots With Bokeh
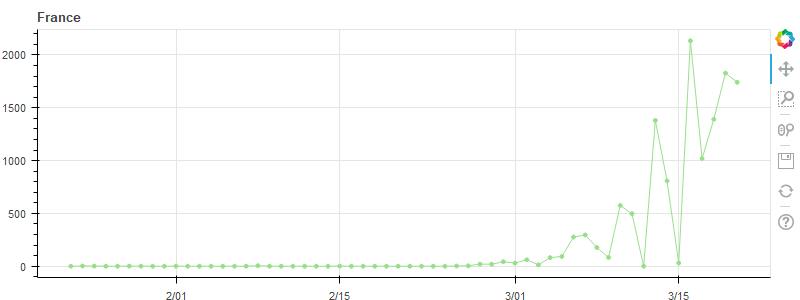
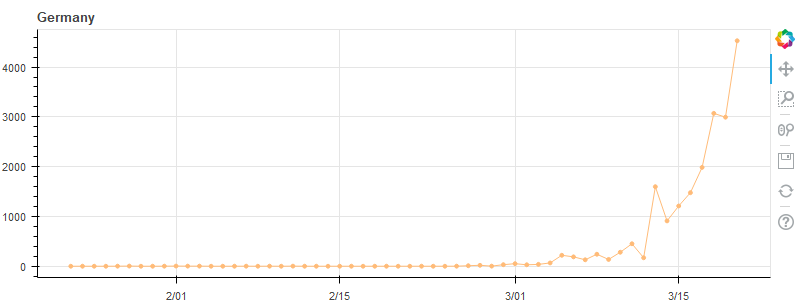
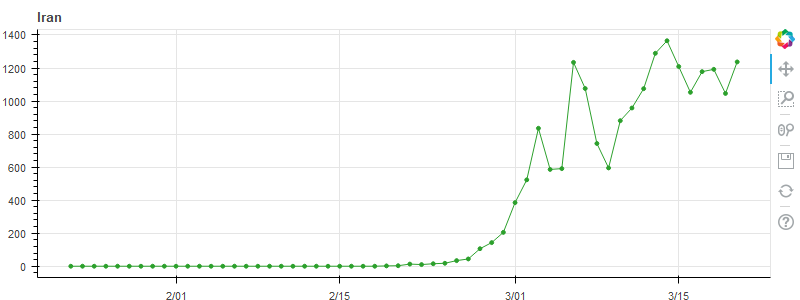
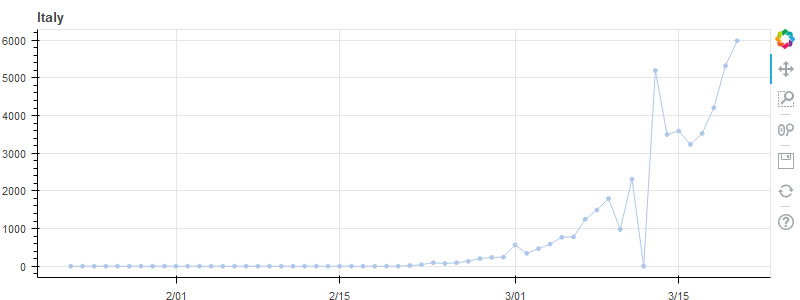
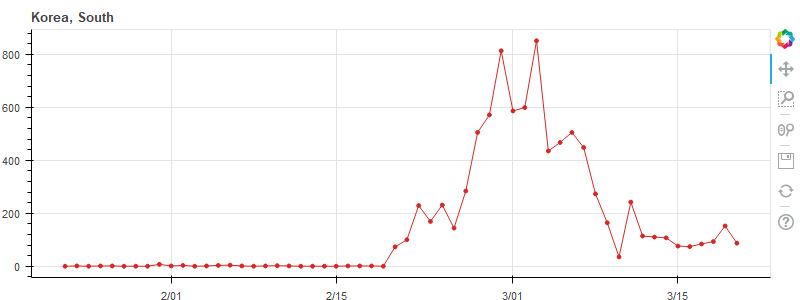
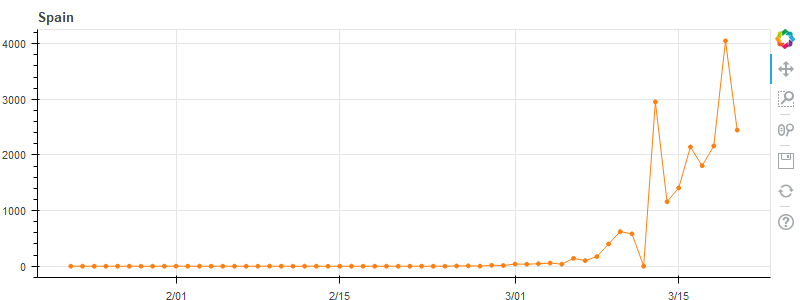
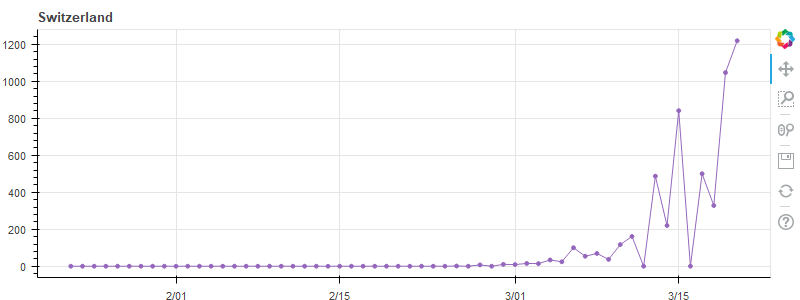
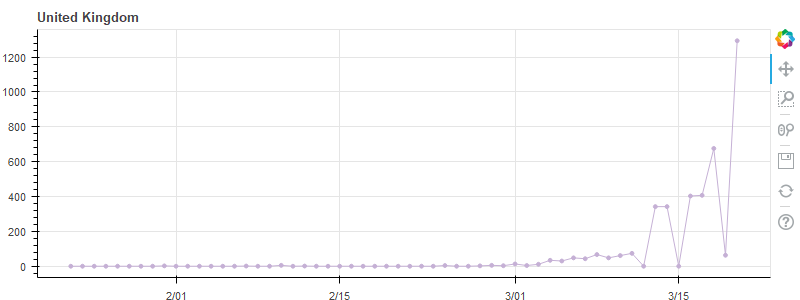
New Daily Cases, March 20, 2020
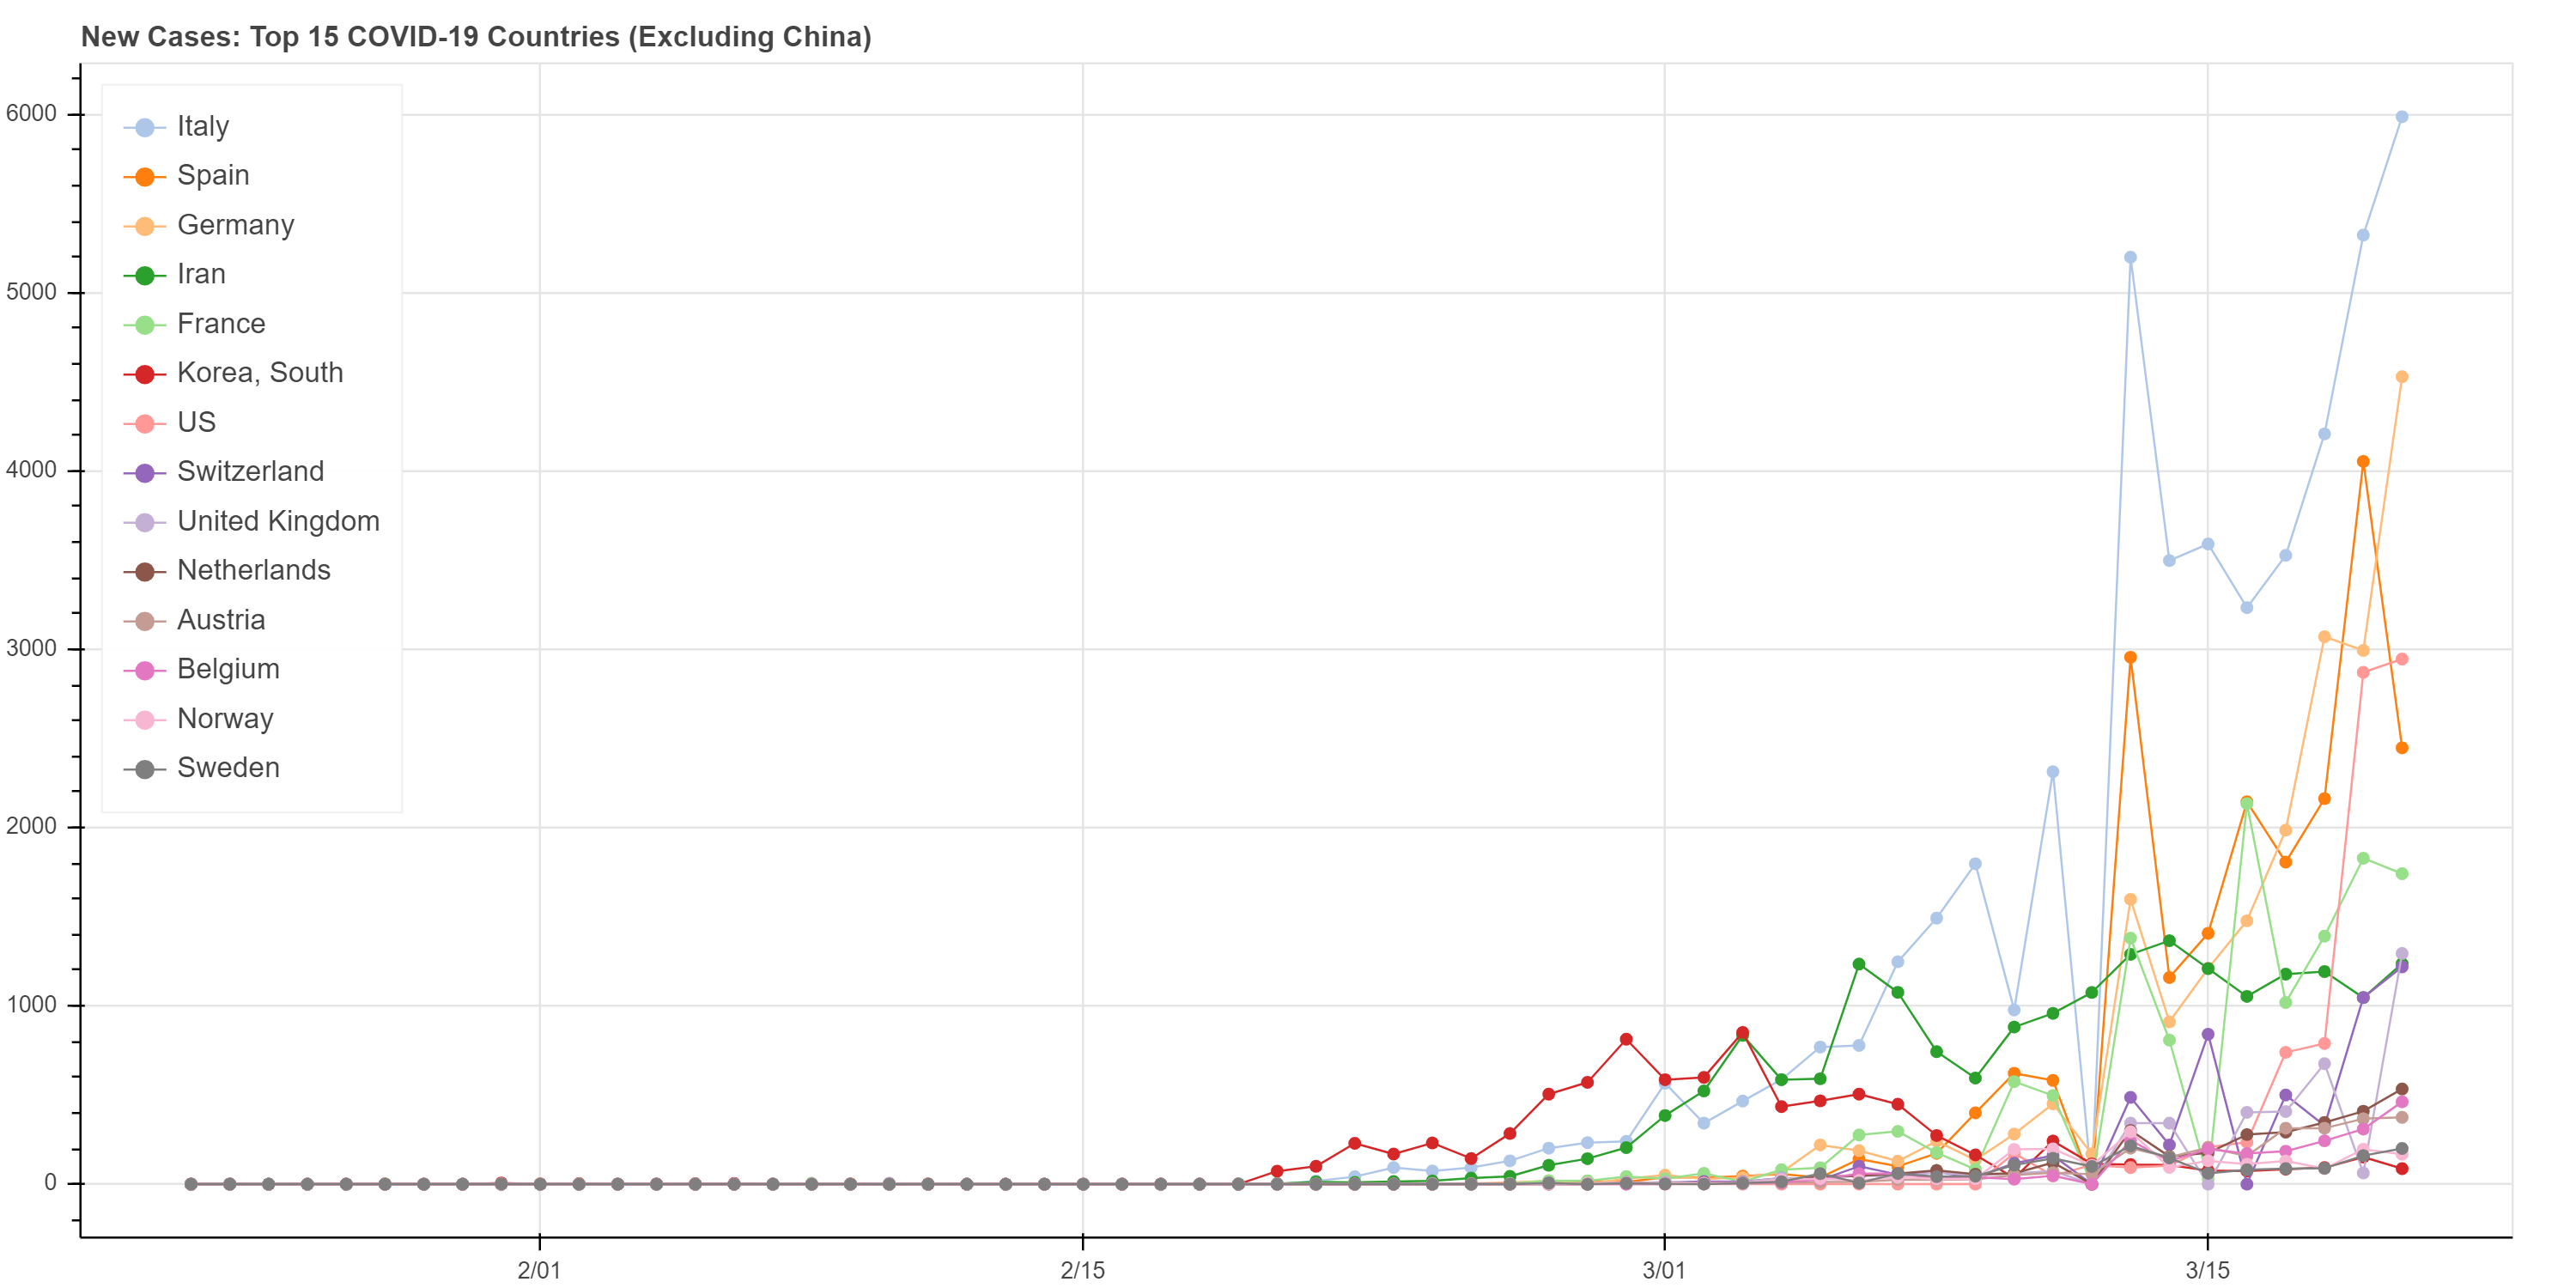
These images are visualizations of COVID-19 new daily cases by country or region as of March 20,2020 created with the Bokeh data visualization app.
You can use the mouse scroll wheel to zoom in/out, and you can use the legend to hide/show time series.
Top 15 Countries New Cases (Excluding China)
The visualization excludes China since that country appears to have reduced the number of new cases significantly and to include it would otherwise dominate over the more relevant and recent data.
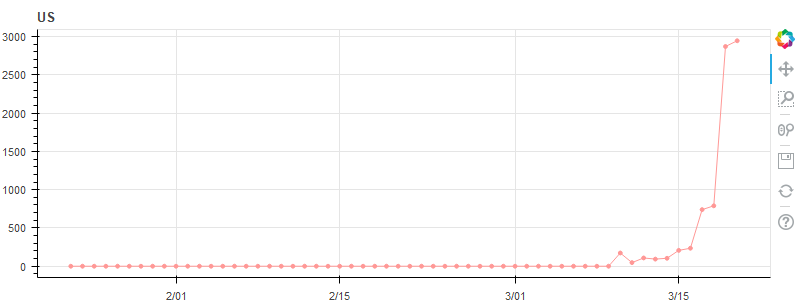
Top 10 Countries New Cases By Individual Country (Including China)