Twitter Disinformation Visualization

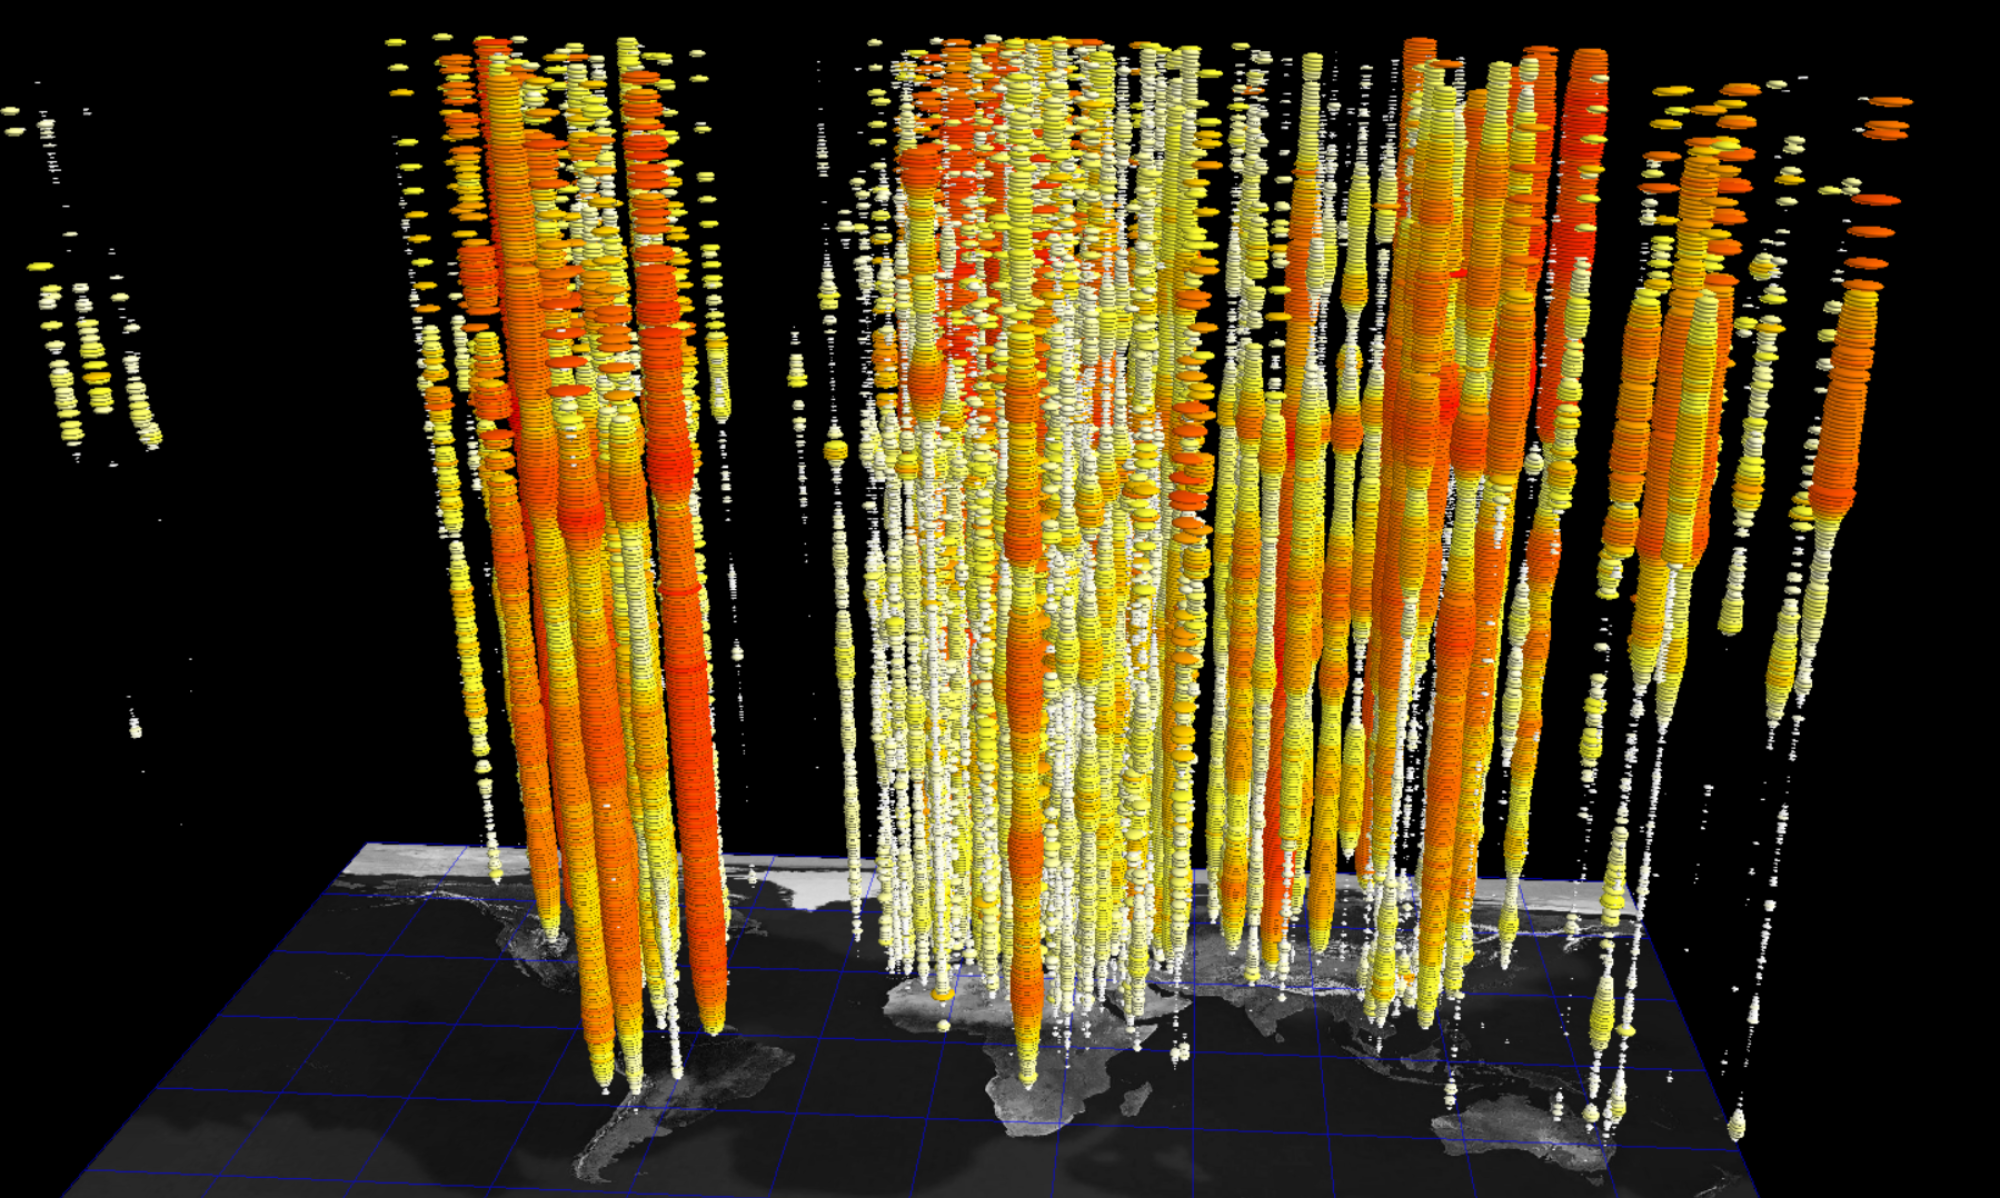
These are some examples of visualization work I did* in an effort to gain insight into disinformation campaigns and twitter bot behavior.

https://www.iluvdata.org/twitter/disinfo/summary.html

Twitter Bot Viz

Twitter disinfo viz

*This work was funded by the Office of Naval Research (Grant N-00014-18-1-2012). Thanks to co-PIs Jen Zeimke and Kate Starbird, with additional acknowledgement to Dave Warner, Robert Alexander, Peter Raymond, Mike Winters, and the rest of the team who made such important contributions. Hat tip to Shane Saxon, developer of the ANTz visualization tool.


COVID-19 Geospatiotemporal Visualization of Confirmed Cases, Global Spread.

Explore my most recent work, visualizing COVID-19 coronavirus global spread of confirmed and new cases.

Above image: Detail of COVID-19 deaths globally.

View more COVID-19 visualizations here: https://www.iluvdata.org/covid19/

Data source: Center for Systems Science, Johns Hopkins University, https://github.com/CSSEGISandData/2019-nCoV

Check out more of my 3D hyperglyph visualizations at https://www.edworlds.com/antz/toroids/.