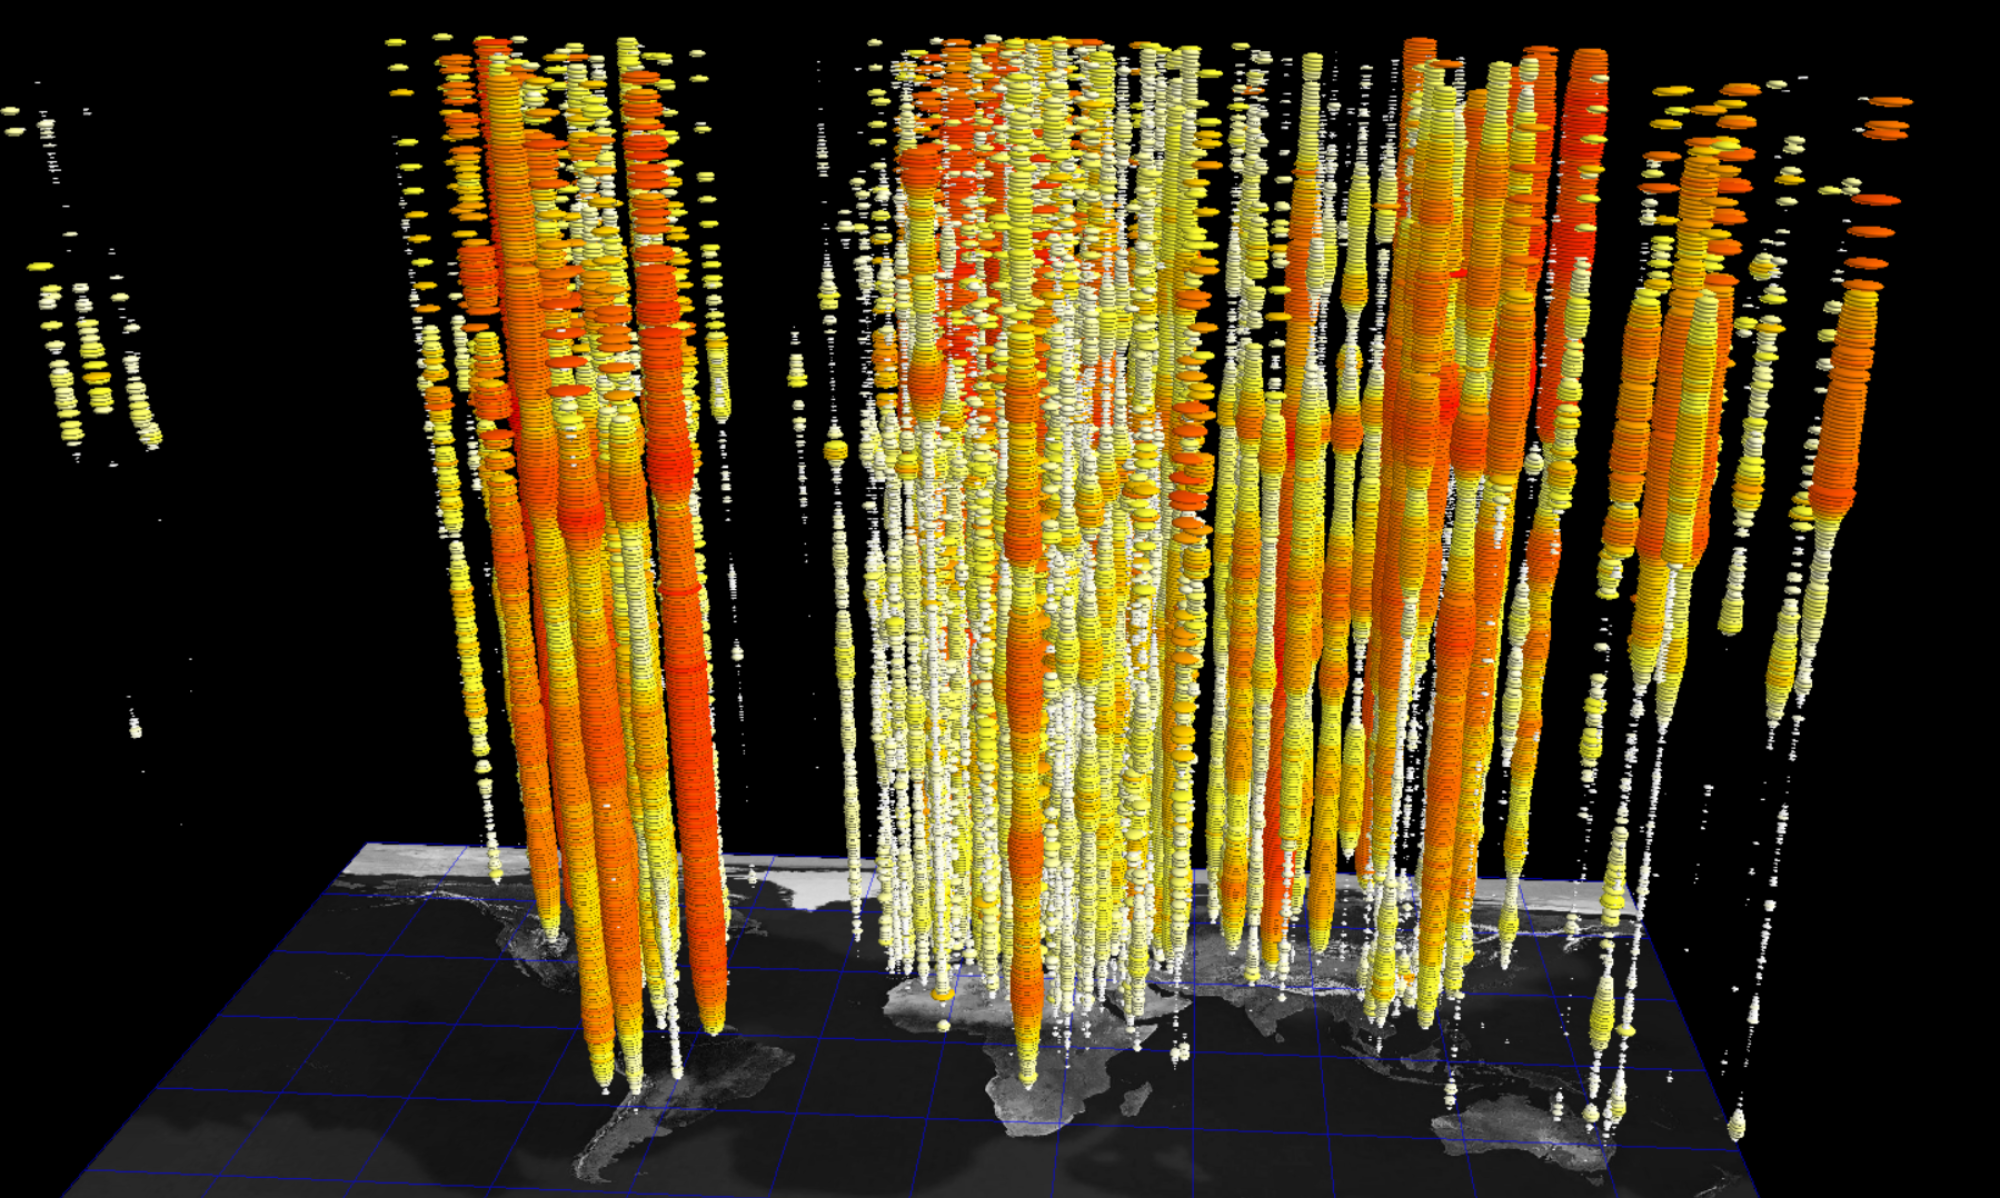
Global Terrorism Database Hyperglyph Visualization
This is an attempt at visualizing the entire GTD in a single visualization, or subsets thereof, using hyperglyphs to help provide visual summaries of terrorist group behavior graphically associated with their sites of attack.
This data is courtesy of the Global Terrorism Database. Visit the GTD.
