Skip to content

I Luv Data

Explorations Into Perceptual Cybernetics

Month: December 2022

Posted on December 16, 2022December 19, 2022

My Top 10 Twitter Followers Timeline Towers

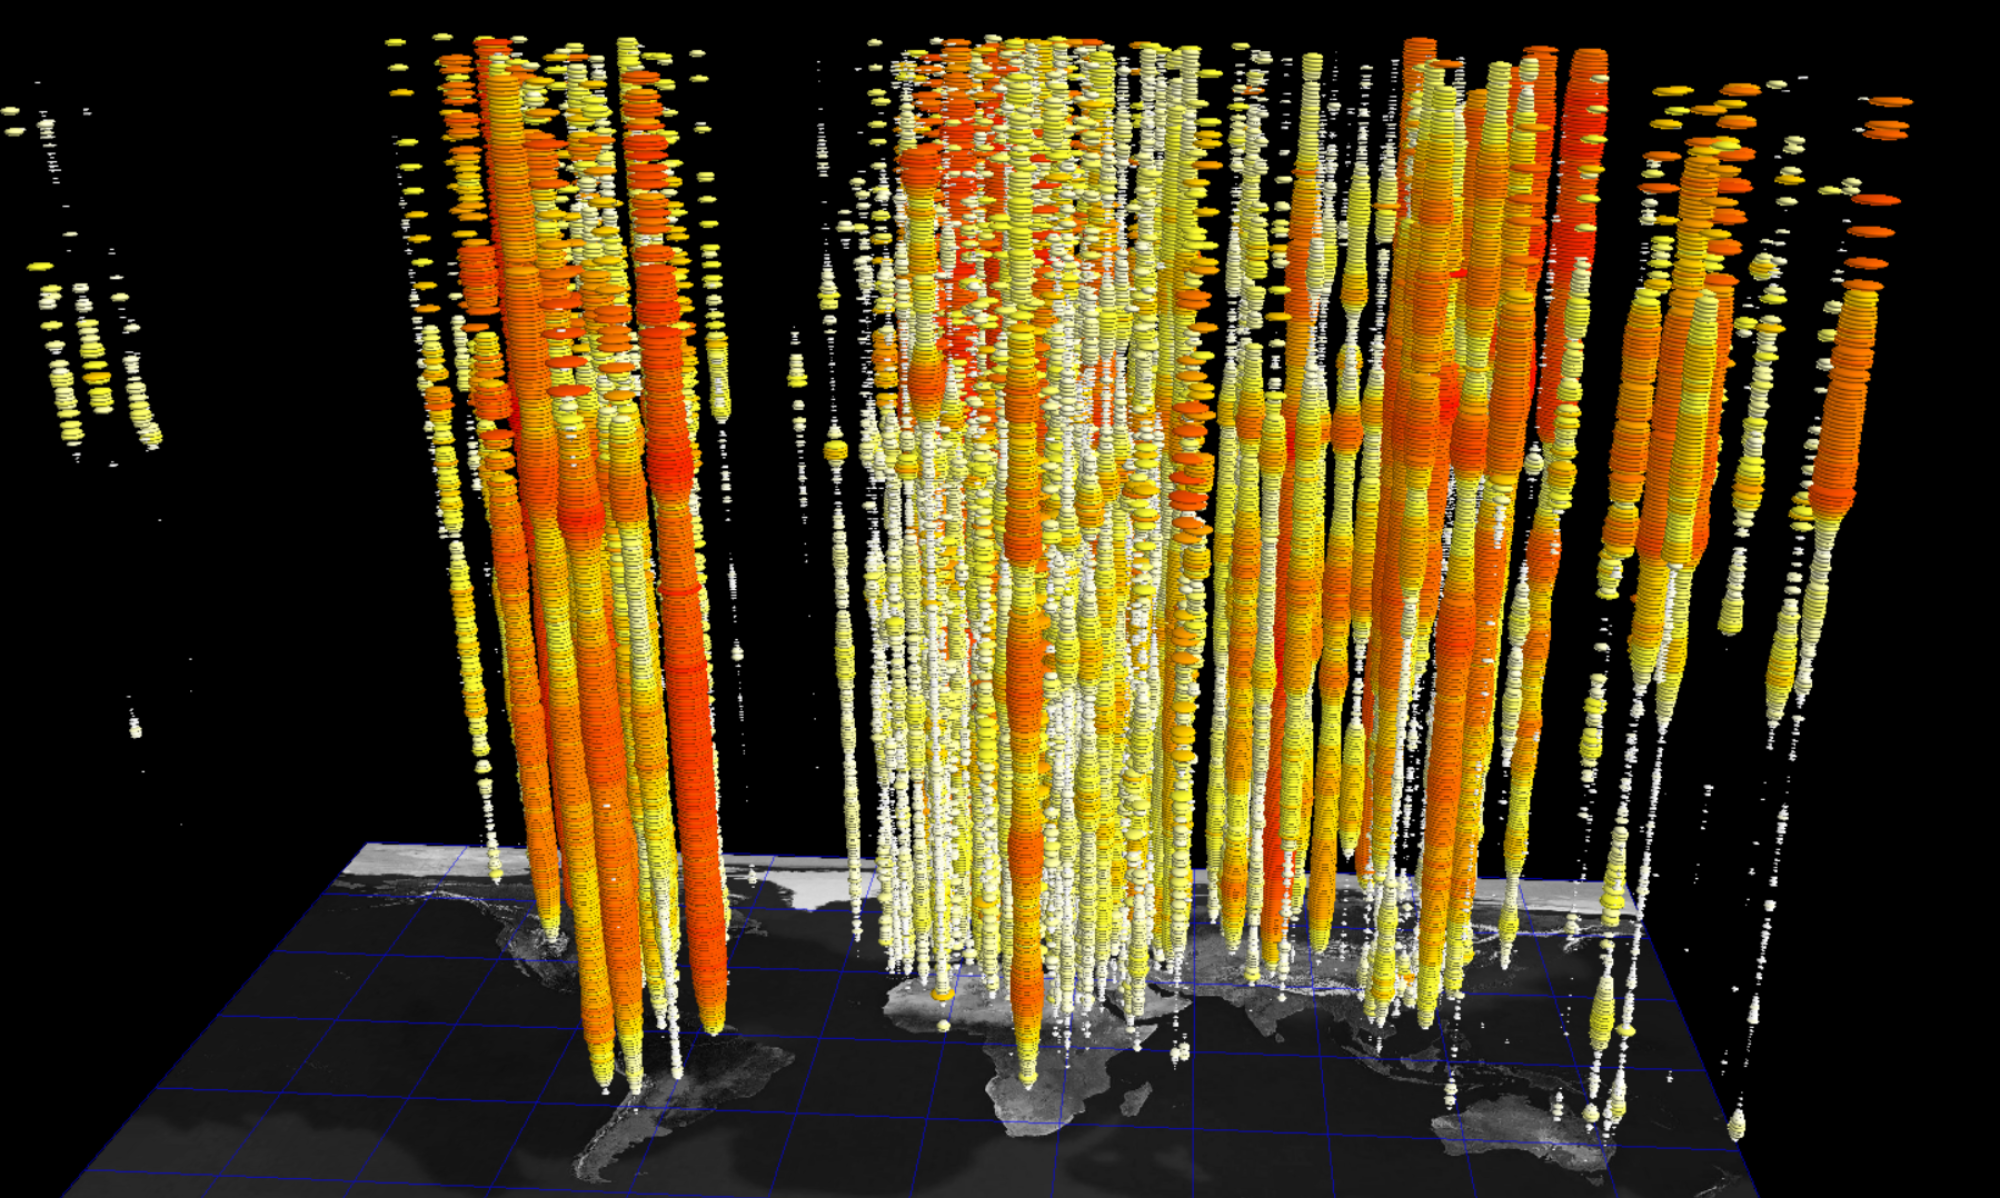
I harvested the accounts of all 475 of my Followers on Twitter with the Twitter API v2 and generated timeline tower visualizations with ANTz of a few of my most-followed Followers just for fun. The diversity of tweeting behavior in just this small subset is a pleasant surprise. I can’t wait to do more.

View more of them here.


Recent Posts

  • Fractal Drawing Carousel
  • Final COVID-19 Geospatiotemporal Visualization of Global Spread Over Time
  • My Top 10 Twitter Followers Timeline Towers
  • Twitter Data Visualization – #climatechange
  • Fractal Pattern Drawing Program

Recent Comments

    Archives

    • March 2025
    • September 2023
    • December 2022
    • November 2022
    • September 2022
    • August 2021
    • March 2020

    Categories

    • Uncategorized

    Meta

    • Log in
    • Entries feed
    • Comments feed
    • WordPress.org
    Proudly powered by WordPress