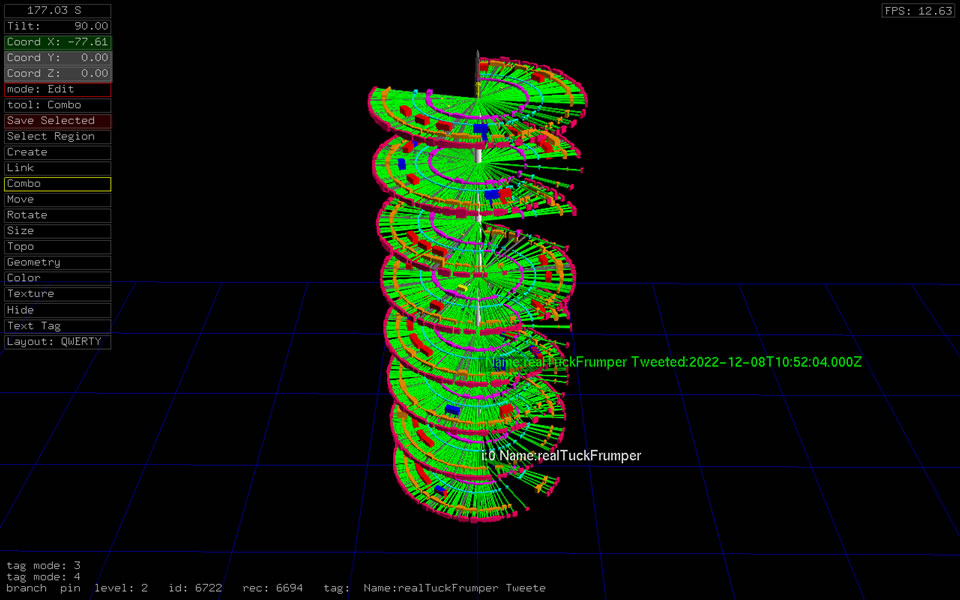
Twitter User Timeline Towers
The Twitter API allows collecting the most recent 3200 tweets of any public user, but finding ways to interact with all of that data in order to gain insight into user behaviors can be a challenge. Here are examples of how to view and interact with a Twitter user's timeline tweet data using Python and the ANTz 3D visualization tool. Learn more about how this visualization developed and how it was used to explore Twitter bot behavior.
Here's a link to the Github repo containing Jupyter Notebook Python scripts to create your own Twitter user timeline towers.
Twitter Users Who Follow Me
Below is a sample of Twitter timeline towers for the 475 Twitter users who currently follow me as of December 2022. View and download more examples.
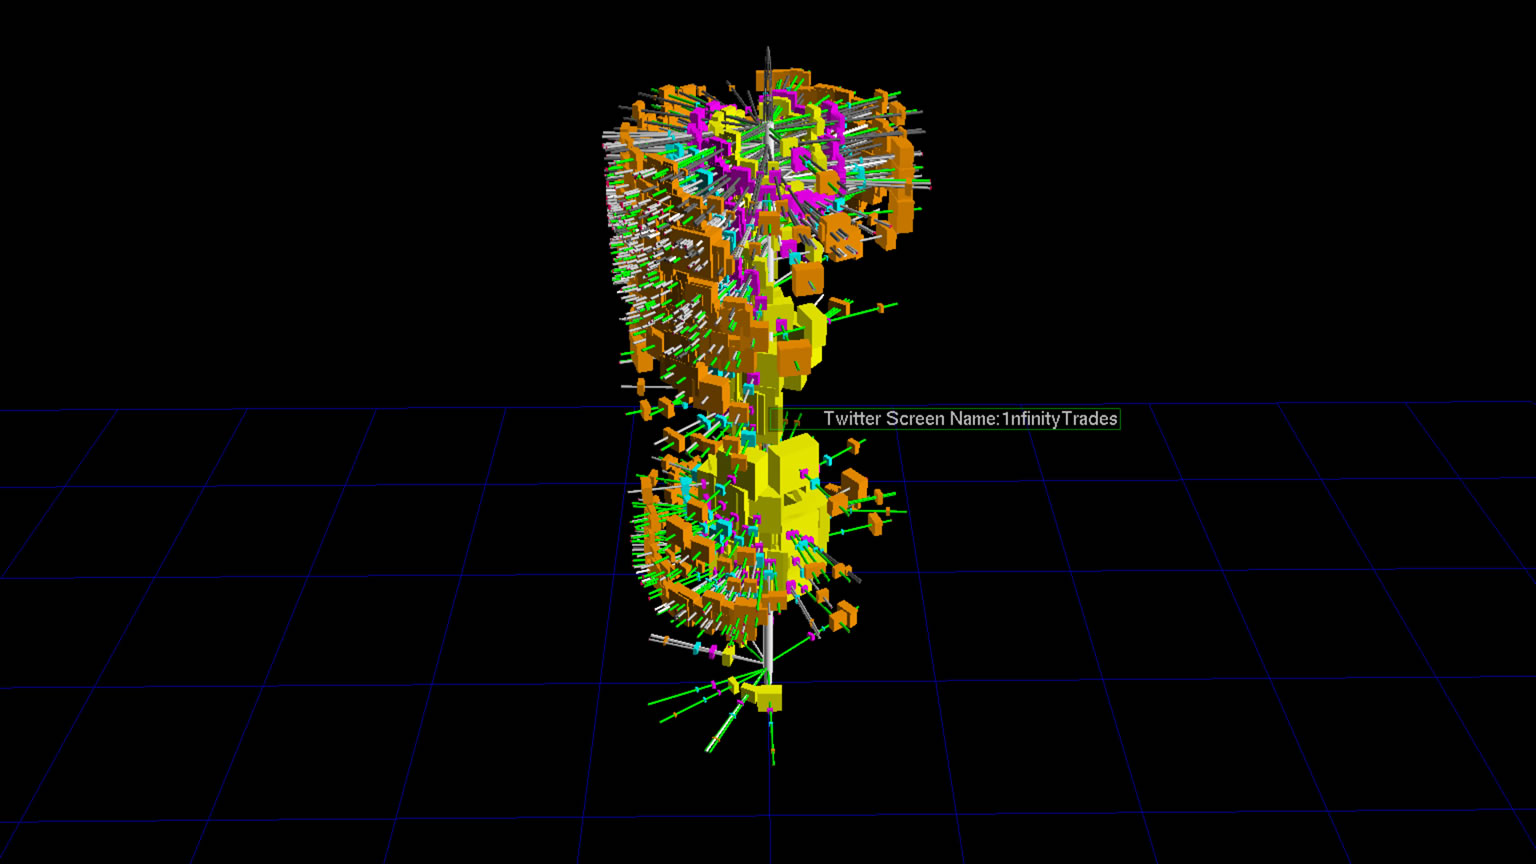
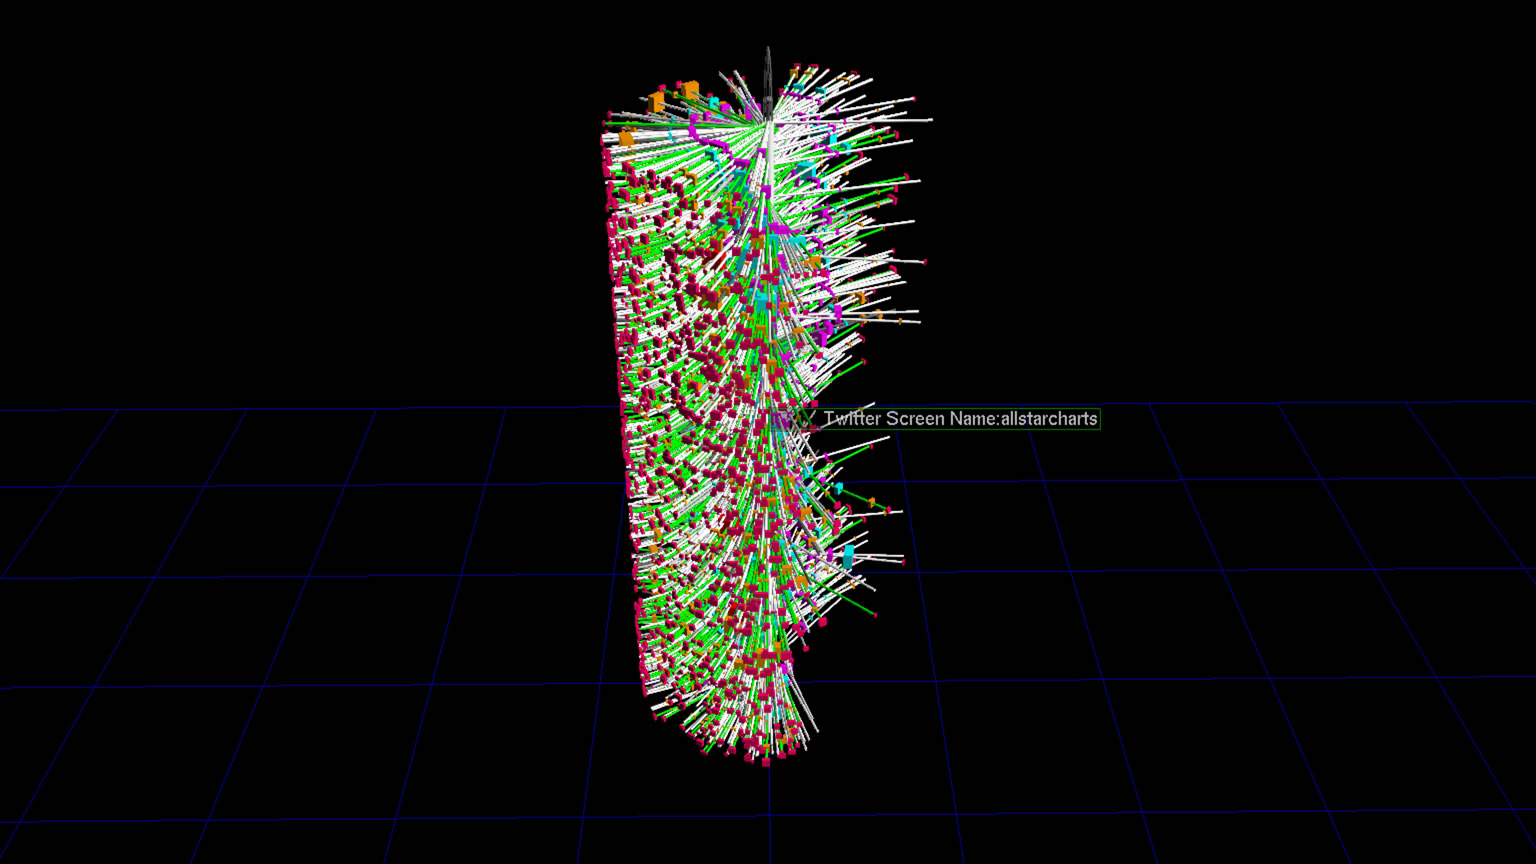
Twitter Users Who Frequently Tweet #CRYPTO
Below is a sample of Twitter timeline towers for users who were the most active 'tweeters' of the hashtag #crypto during a short period in early January, 2022. View more examples.


