Data
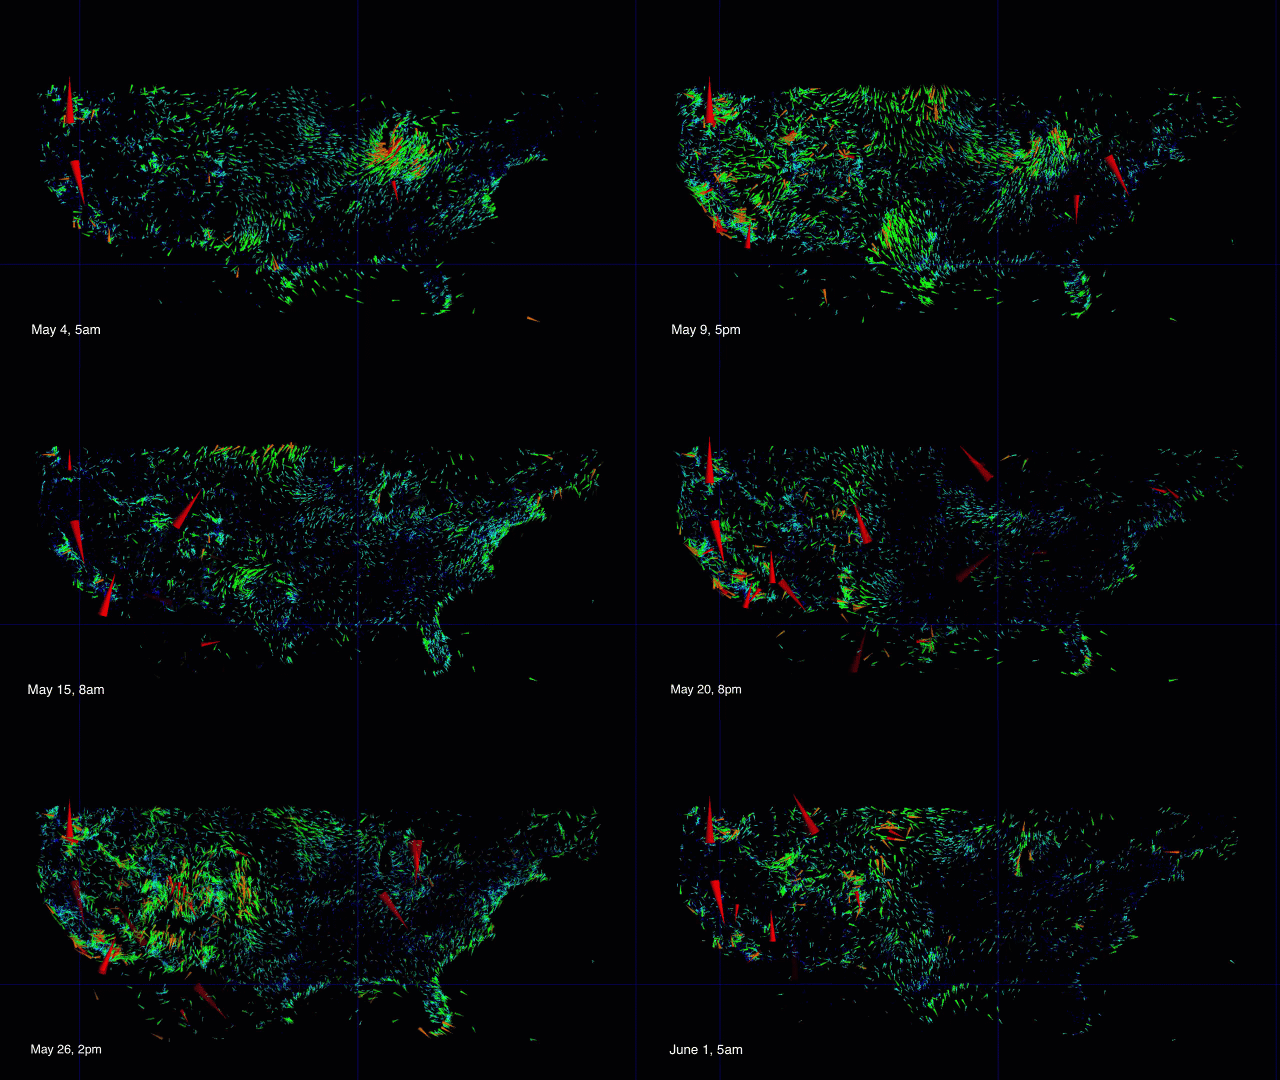
This visualization consists of nearly one months worth of data from a system of stations distributed across the continental US. Data was collected every 3 hours or 8 times per day.
Animation
I rendered individual frames by doing screen captures of each visualization and pieced them together for the animation using Camtasia.
View a larger video of the animation.
Visualization
Download a Windows version of the ANTz sample visualization.
For Mac OS X users, download the generic Mac OS X version and the Windows version and swap the usr folder from the Windows version with the usr folder for the Mac version.
Image Sequence
View the images used to create this video.
Below are some examples of the images in the animation.


