Data Collection
Data was collected for ~8 days, June 19, 1pm, to June 27, 2:45pm. Data was sampled using the Twitter Search API once every 15 minutes, 96 samples per day, 744 total samples, 77585 total tweets (some duplicates), 22448 unique user accounts. Each sample requested the maximum number of tweets allowed for free which is 100 tweets. Some samples fell short of this maximum (see figure for Tweet Counts Per Sample). Tweet data was saved as text files in json format.
Time vs. Top Tweeters Including Duplicate Tweets
Download ANTz visualization of time vs. top tweeters for Windows.
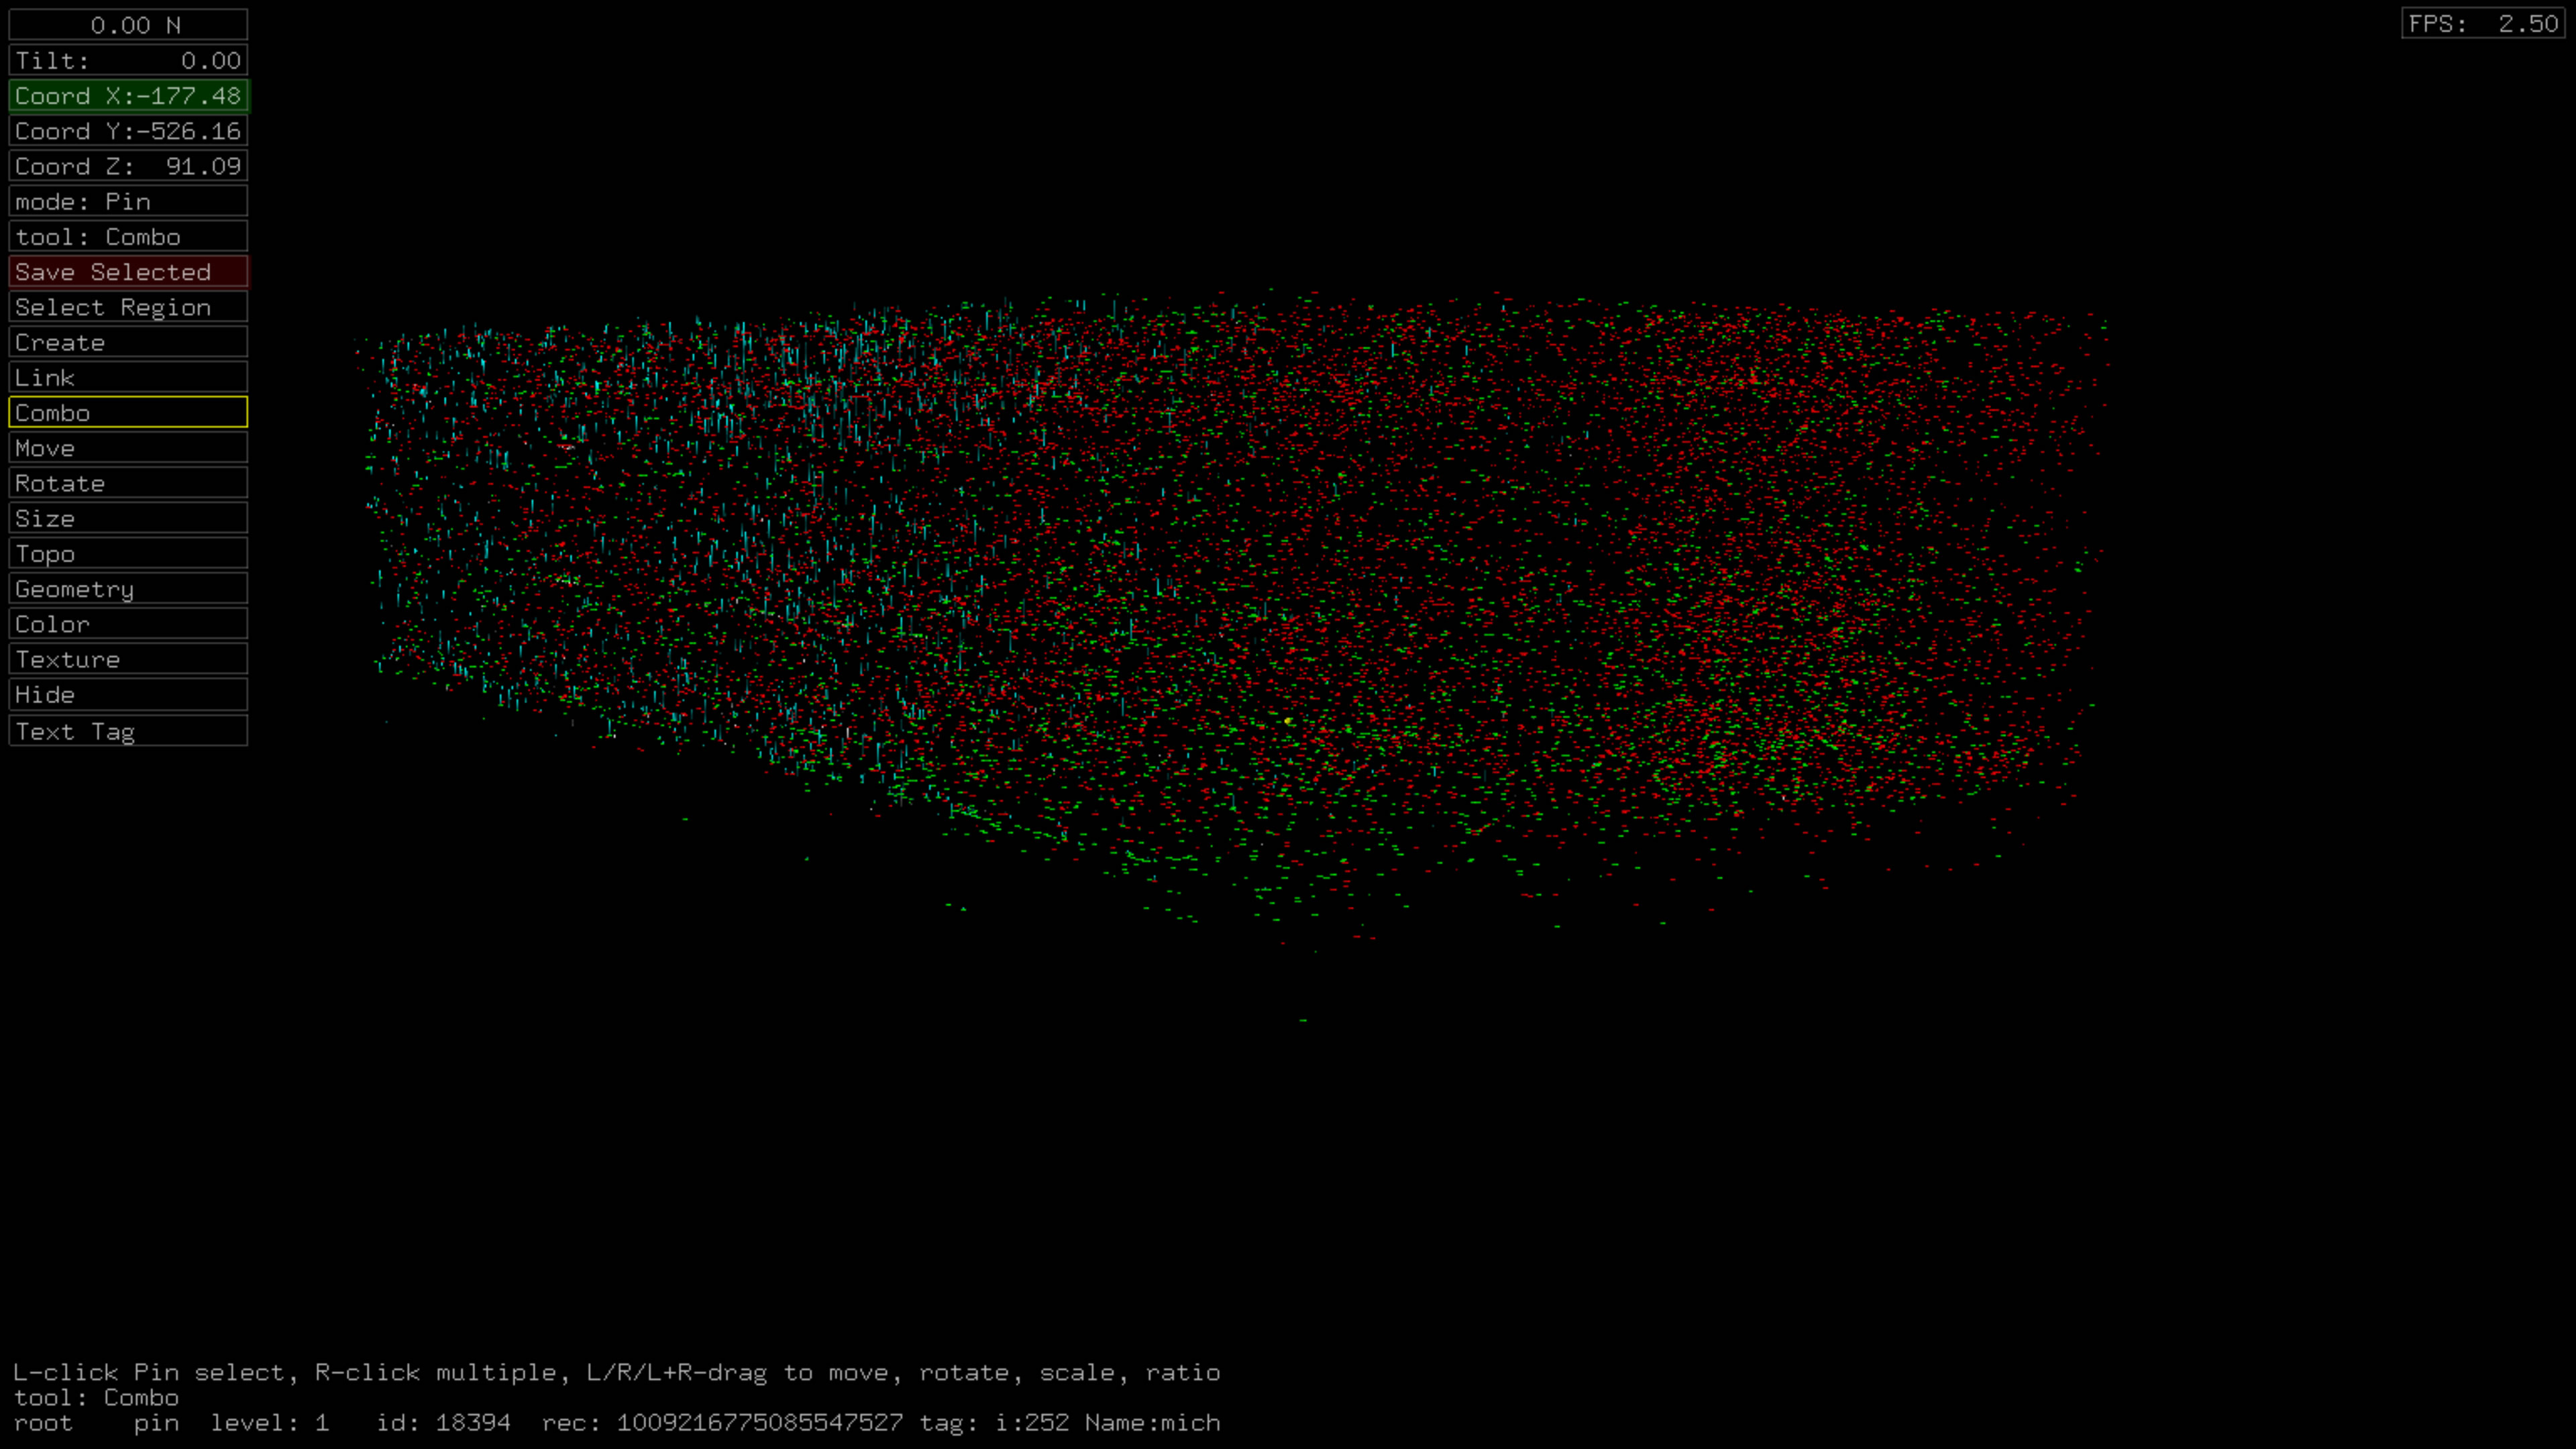
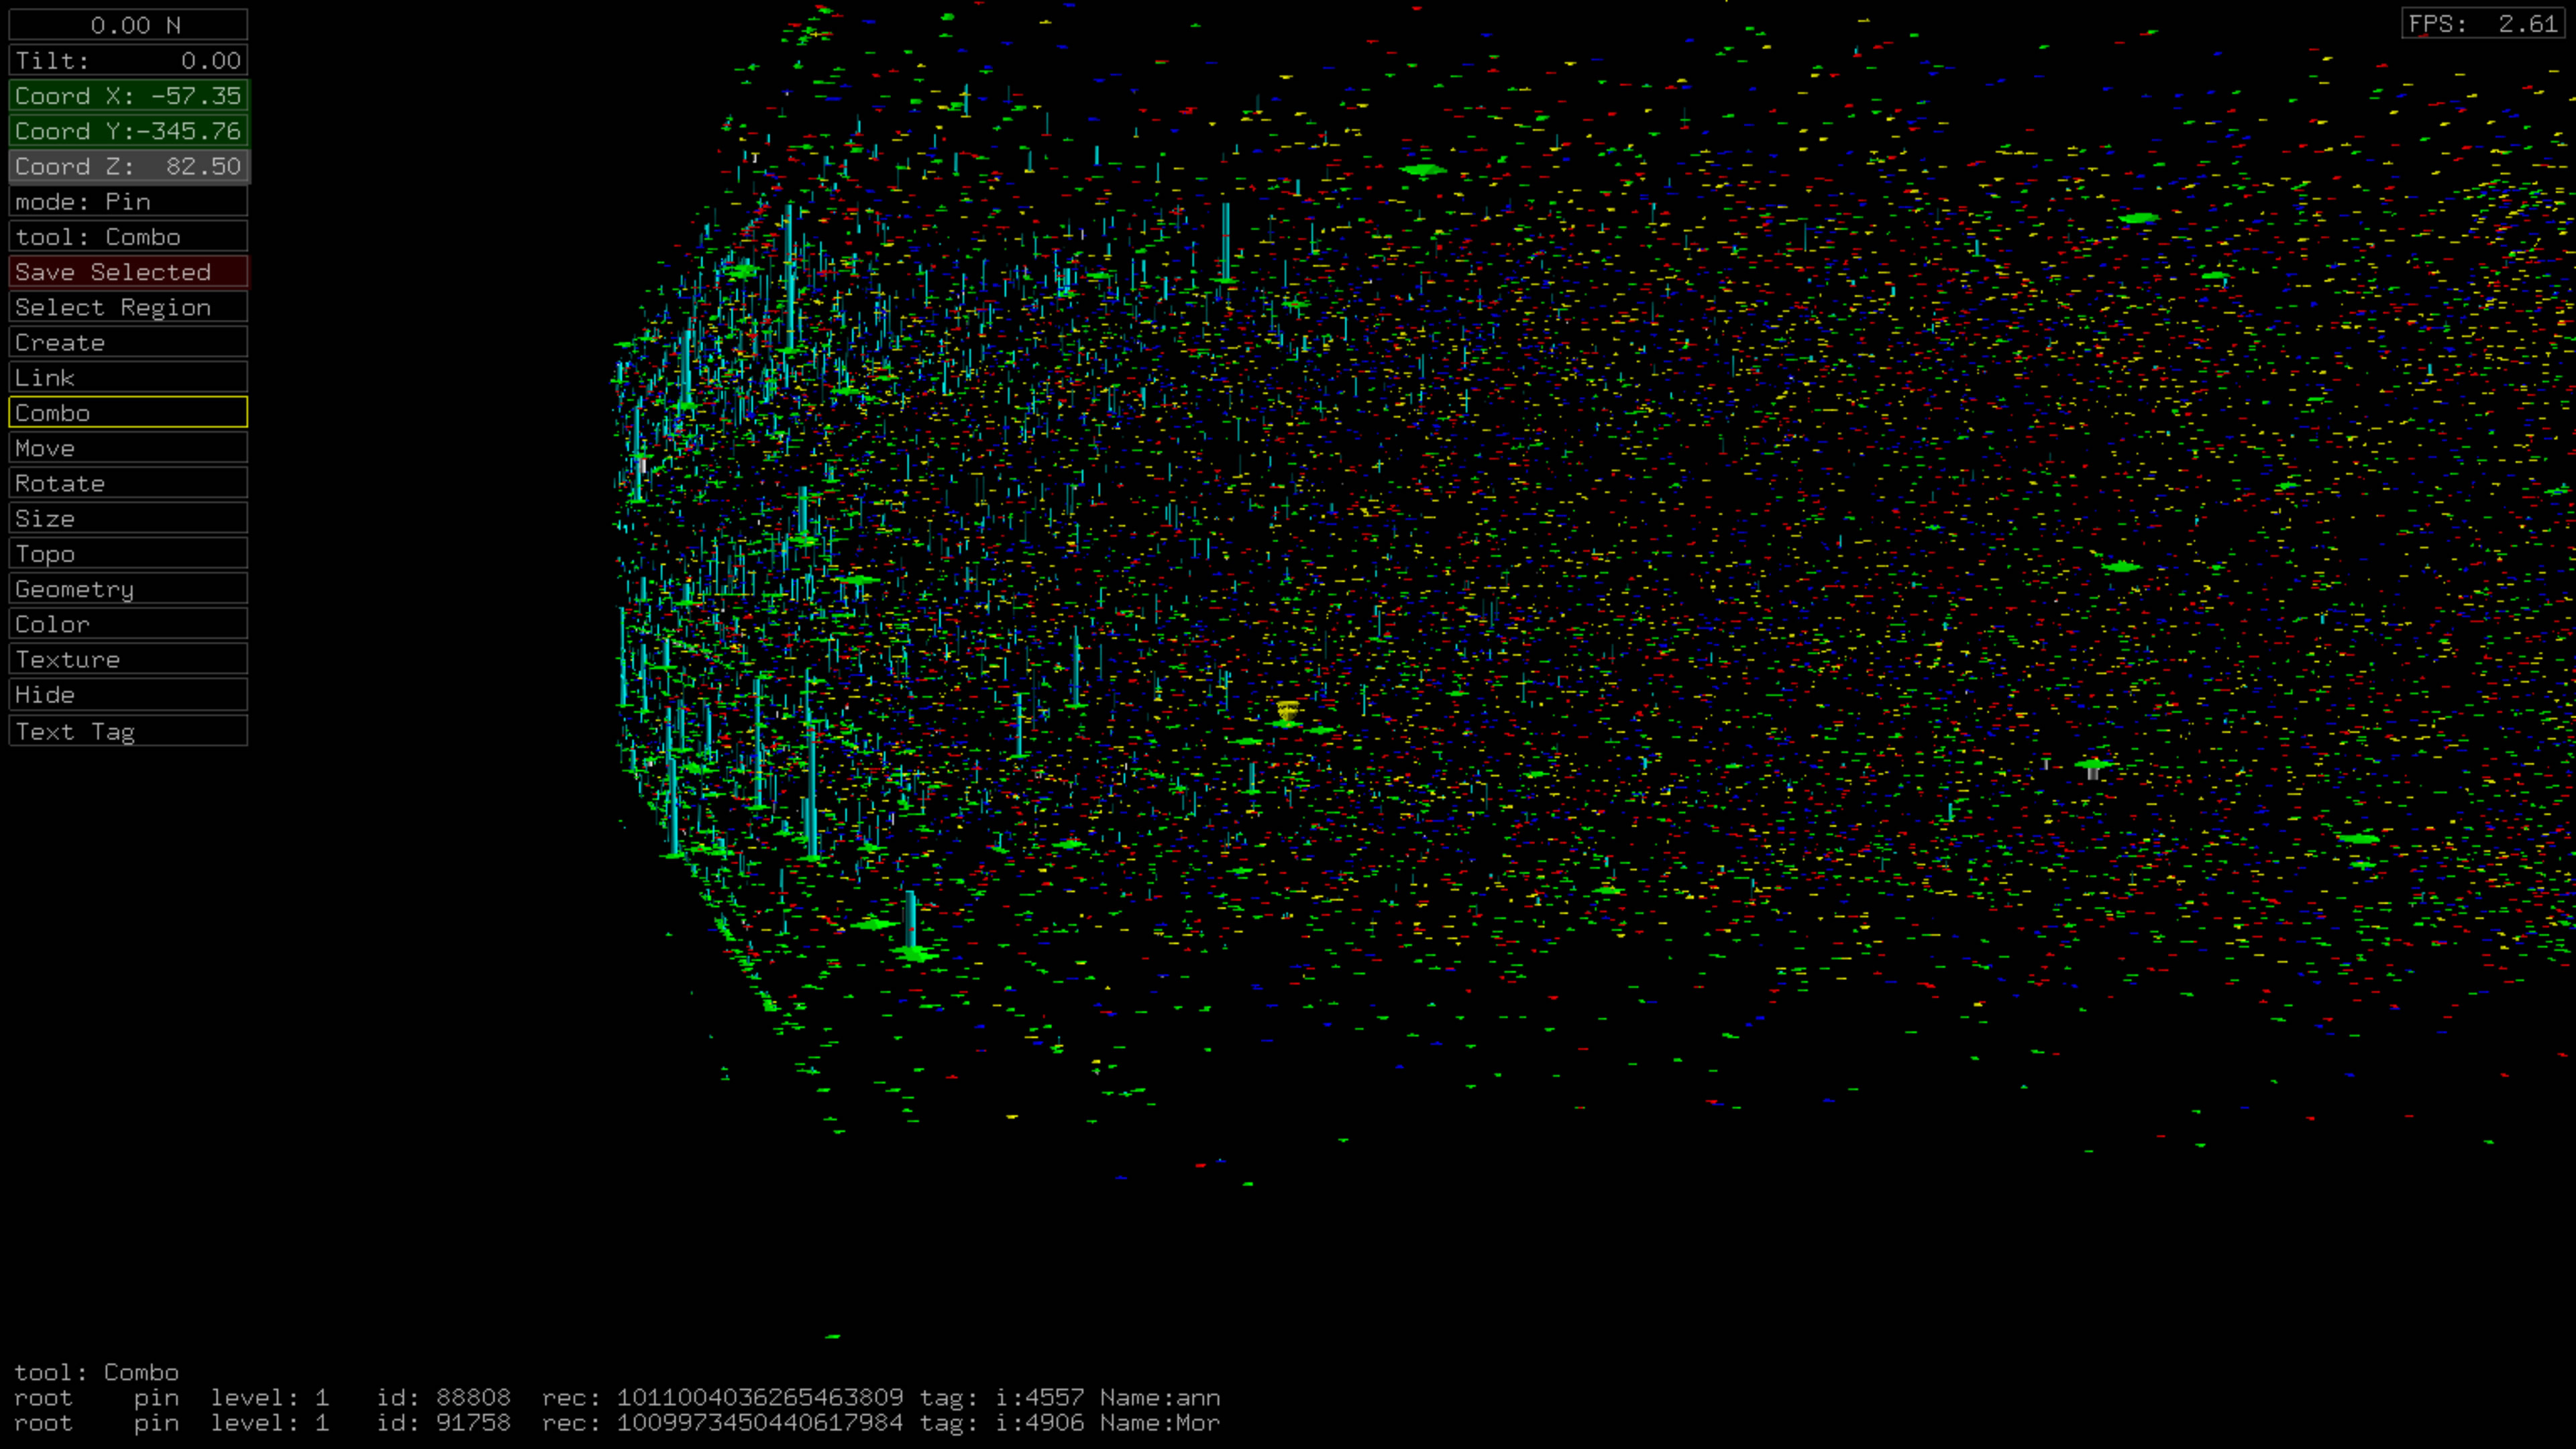
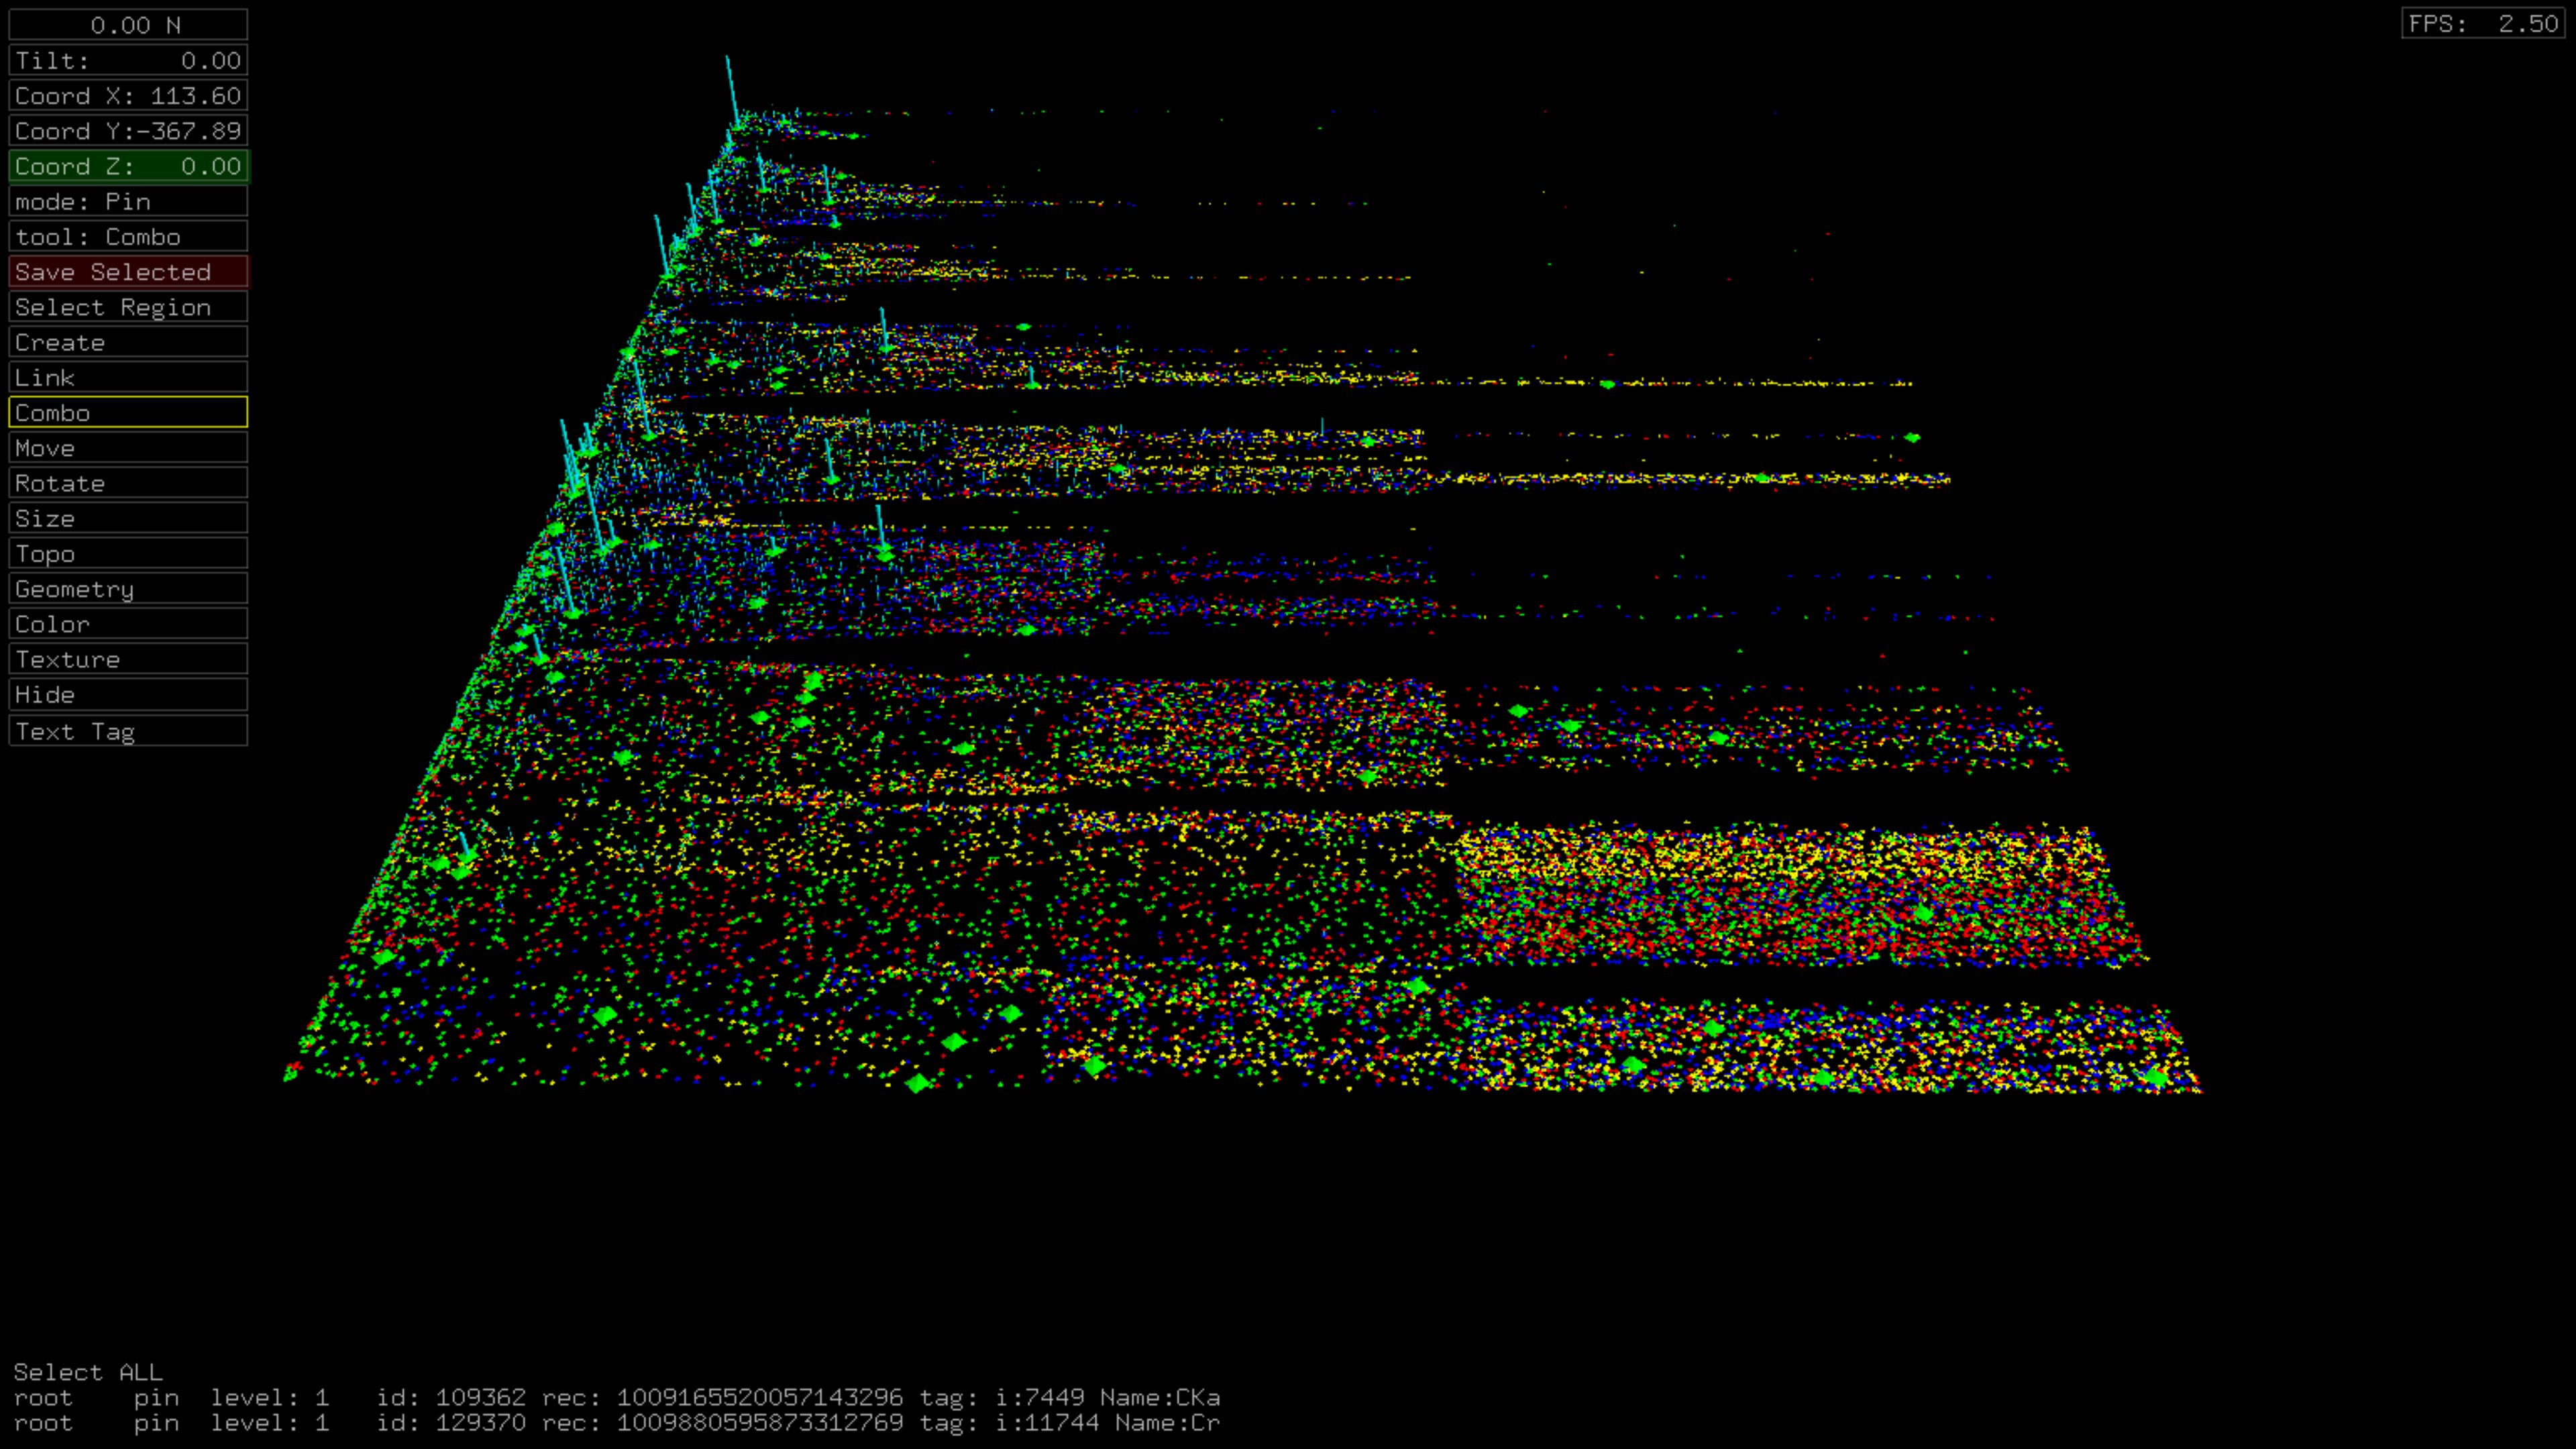
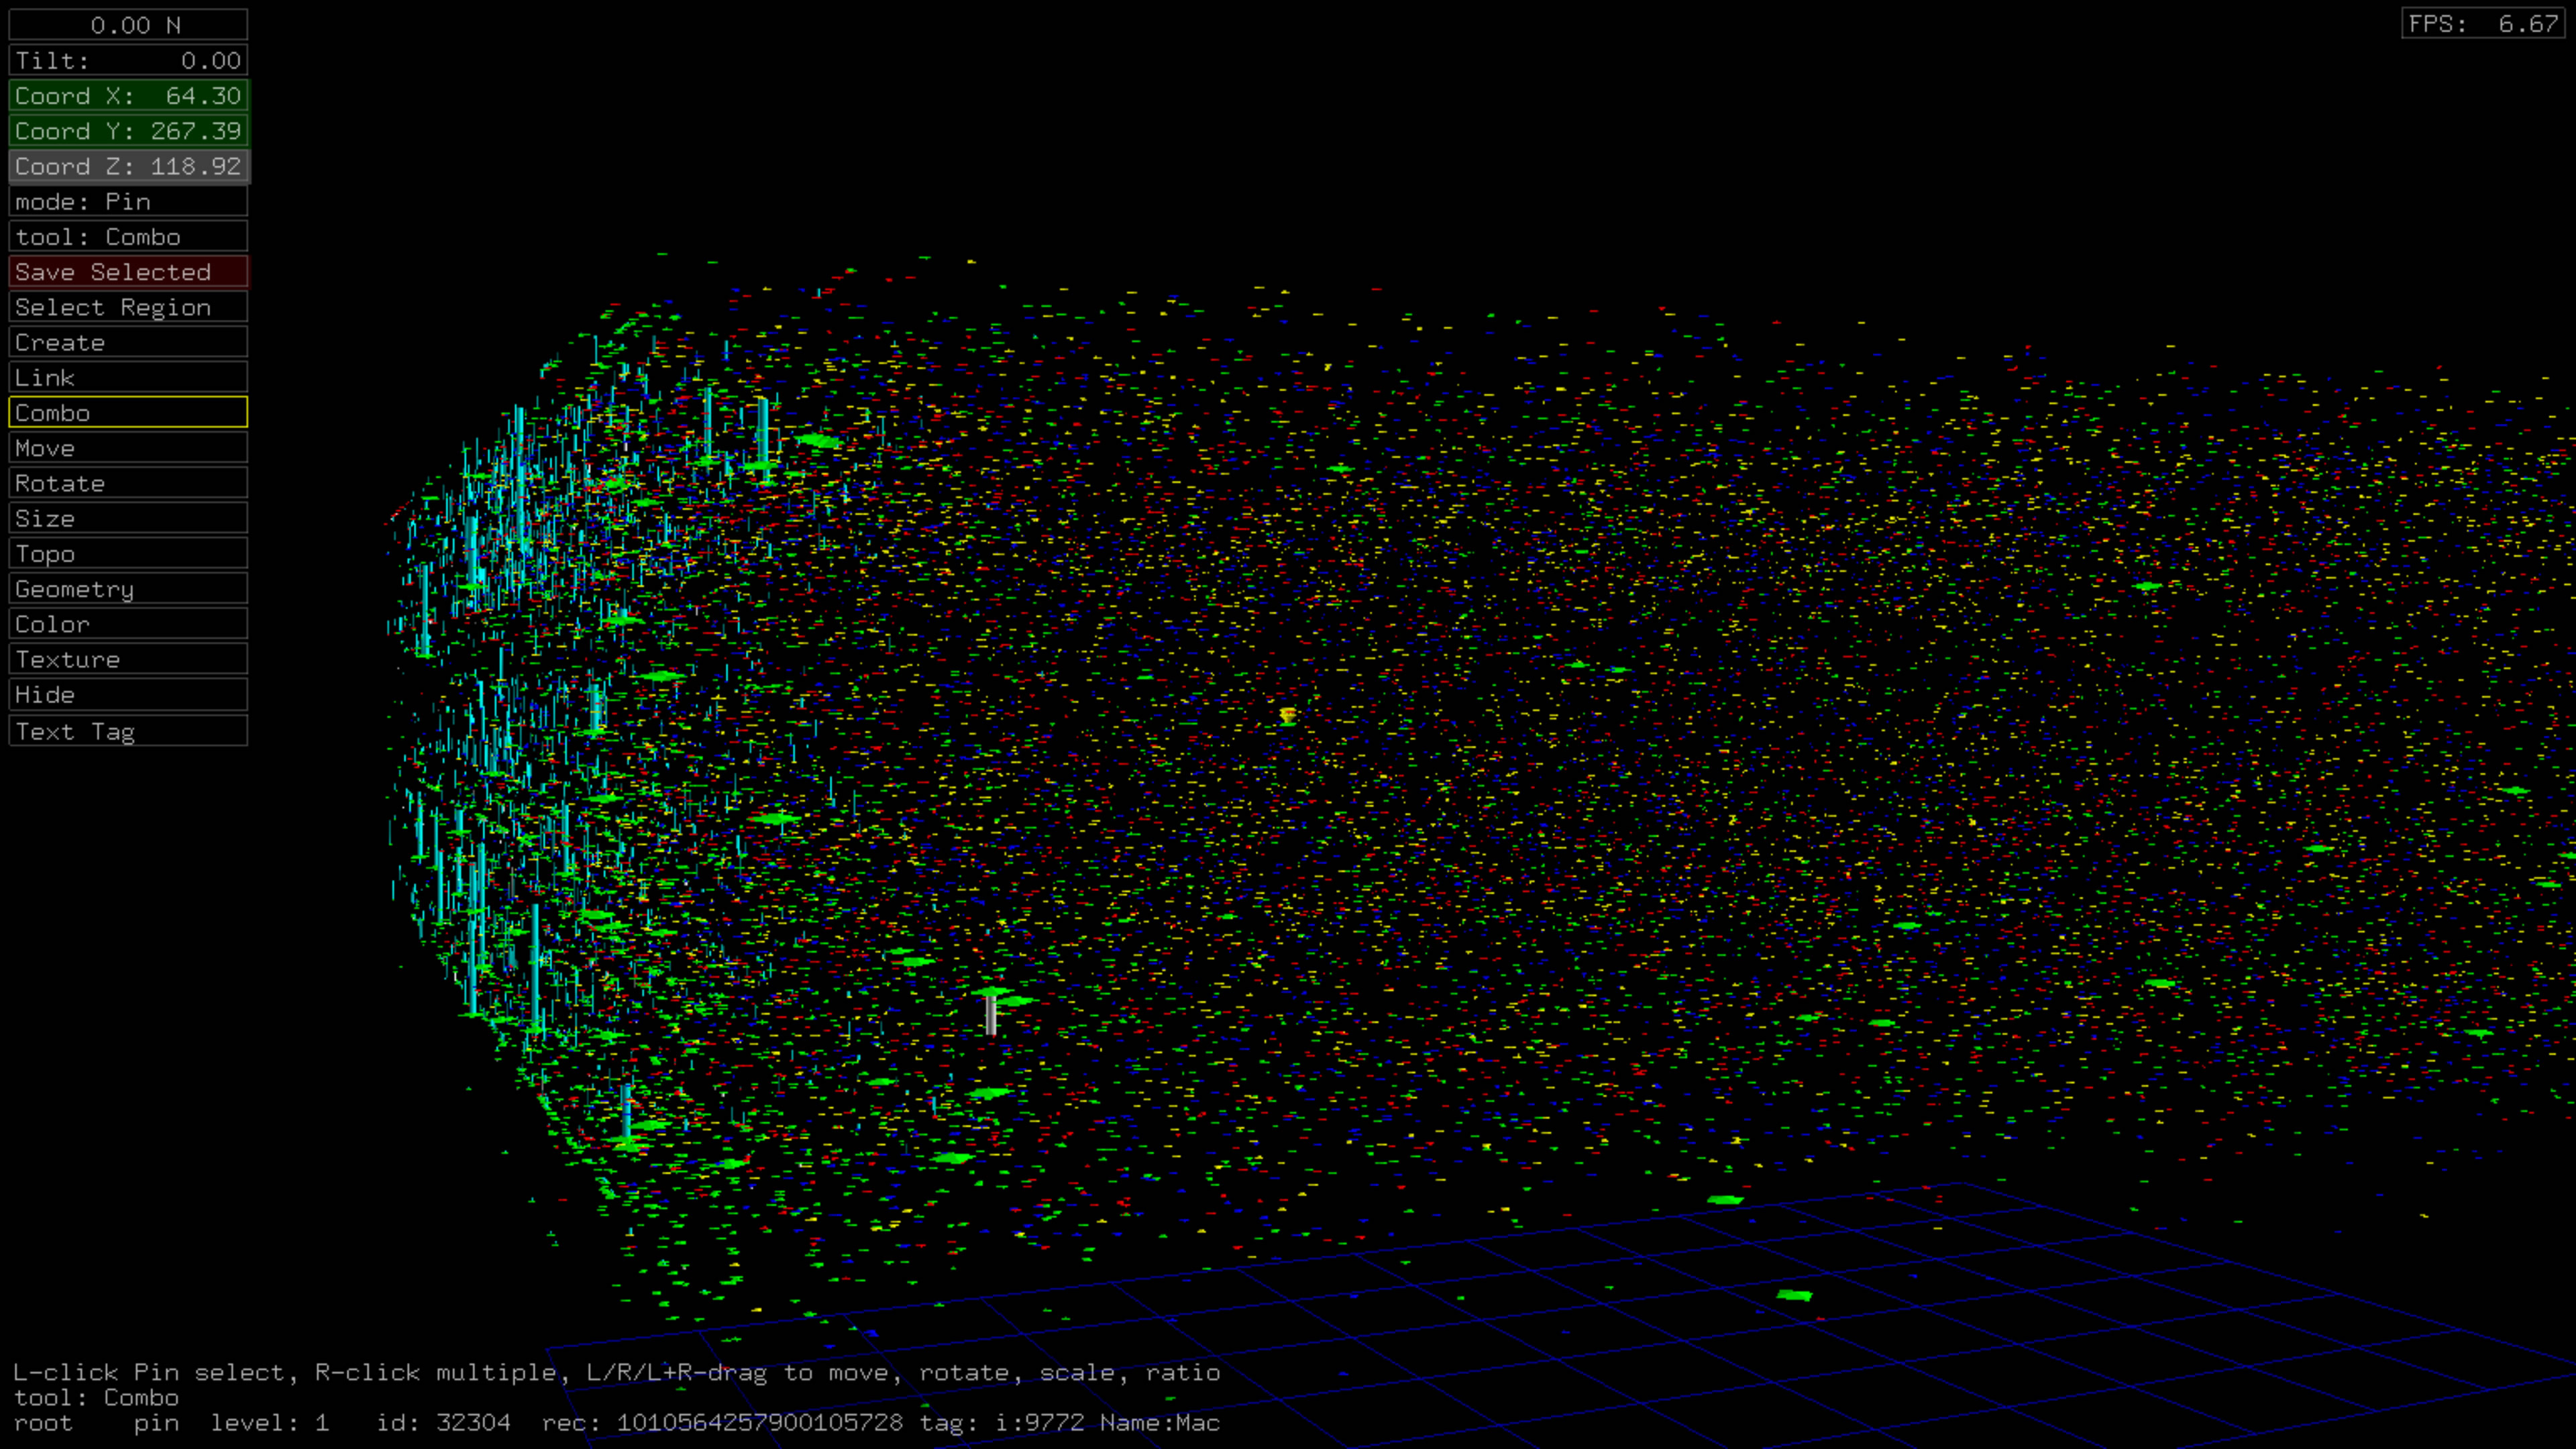
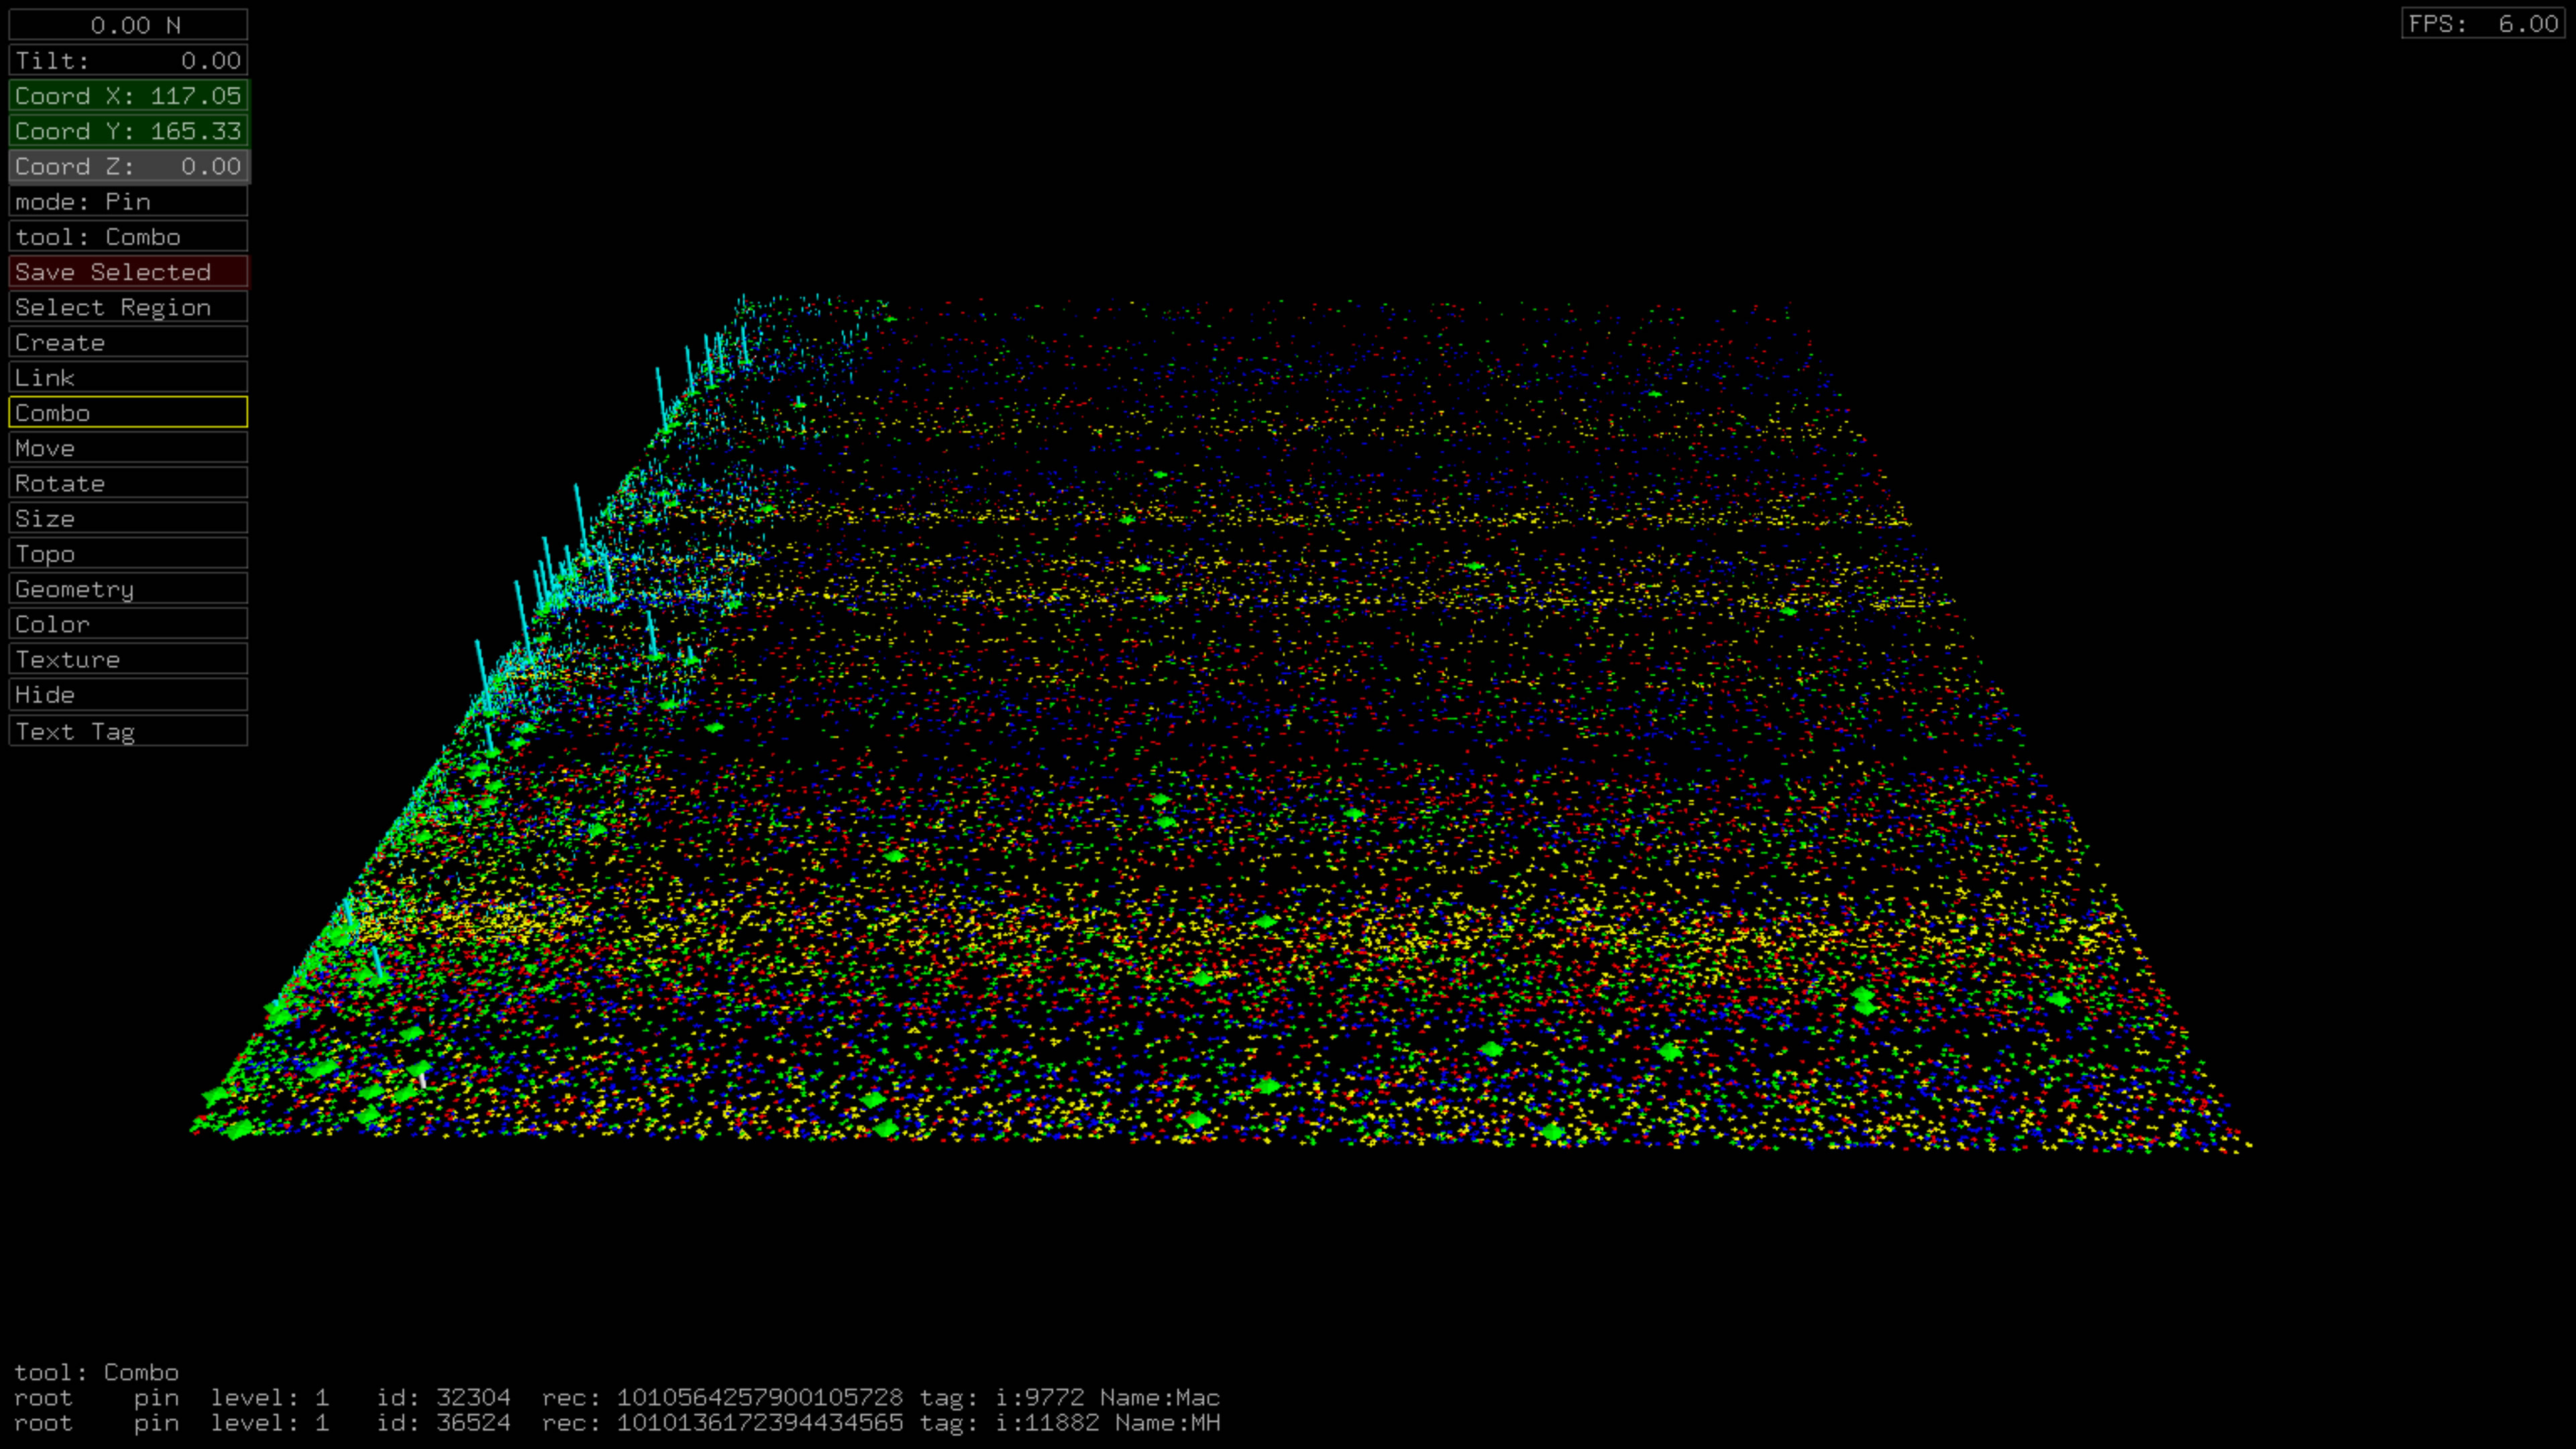
This dataset has a strong resemblance to the #lyincomey dataset but with some differences. There is a more even distribution of original tweets in this dataset, and there appear to be fewer bots in the long narrow 'strands' of tweets on the right. There is also more distinct 'banding' for the user_created_at vertical axis.
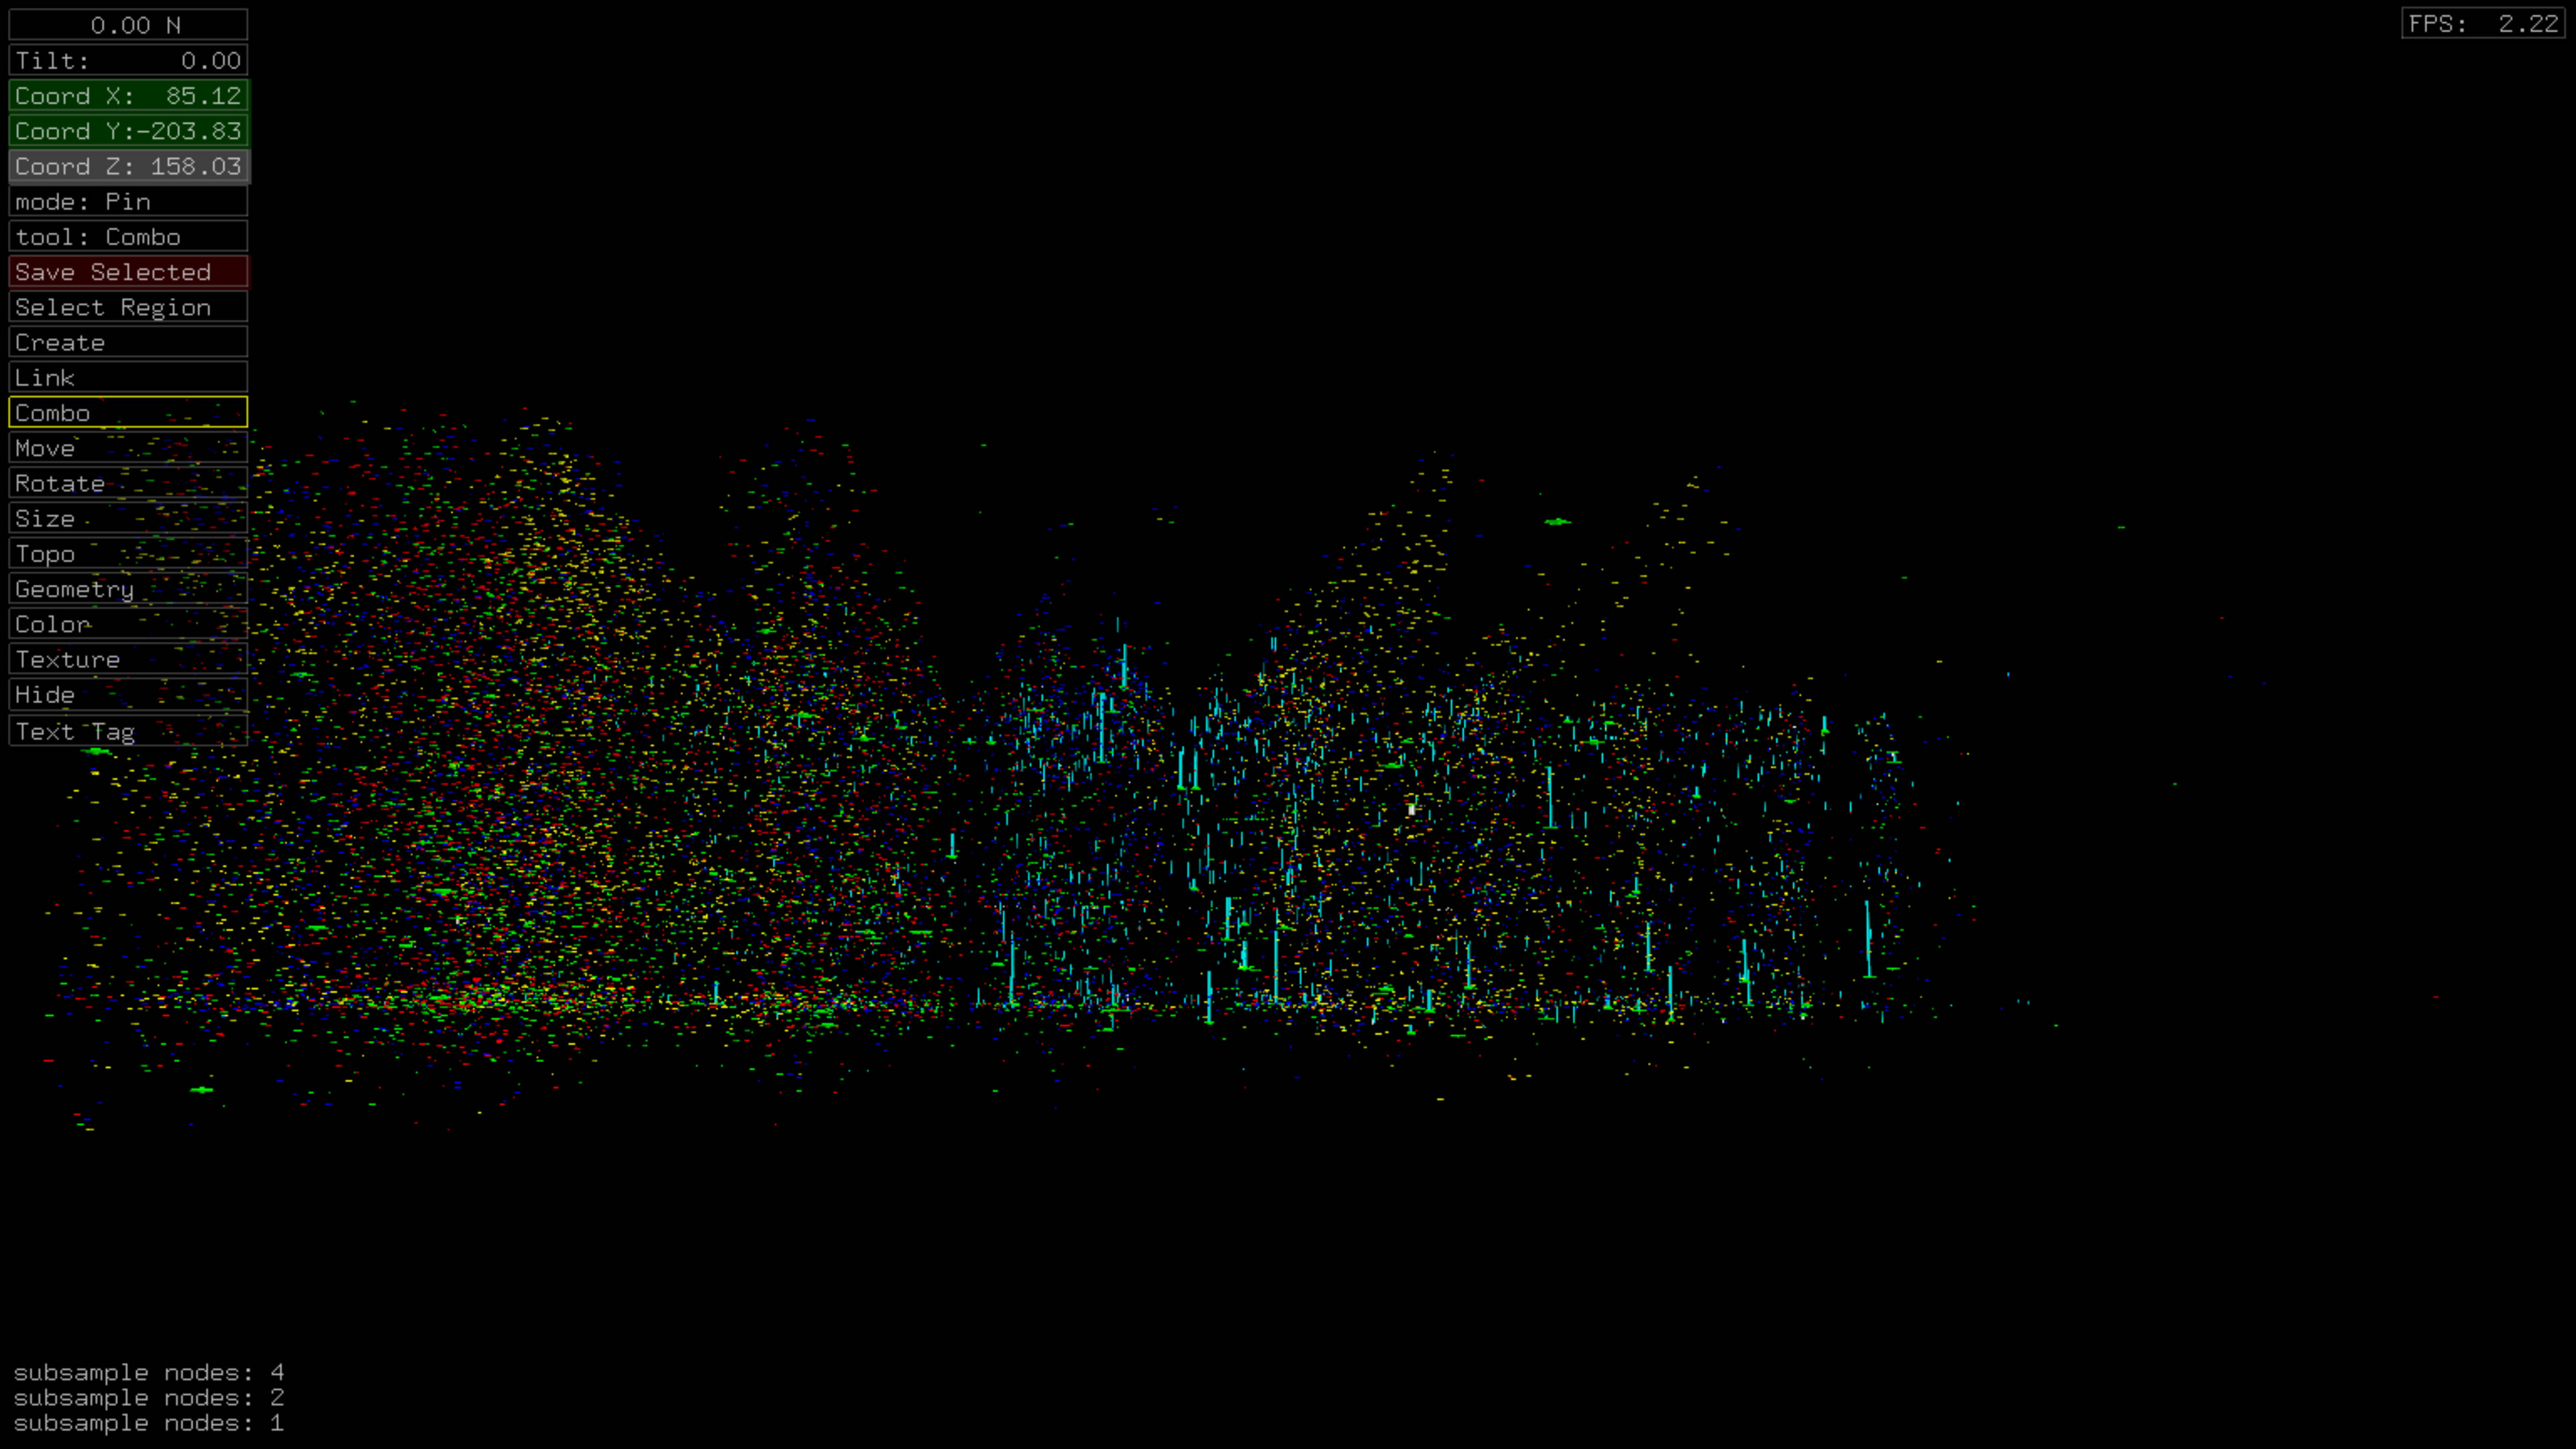
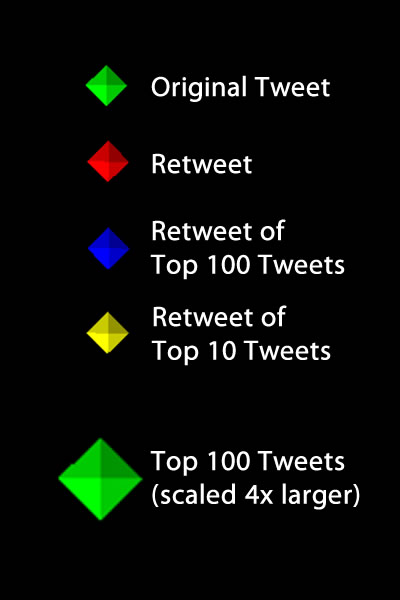
With Top 100 and Top 10 Retweet Color-Coding
Legend
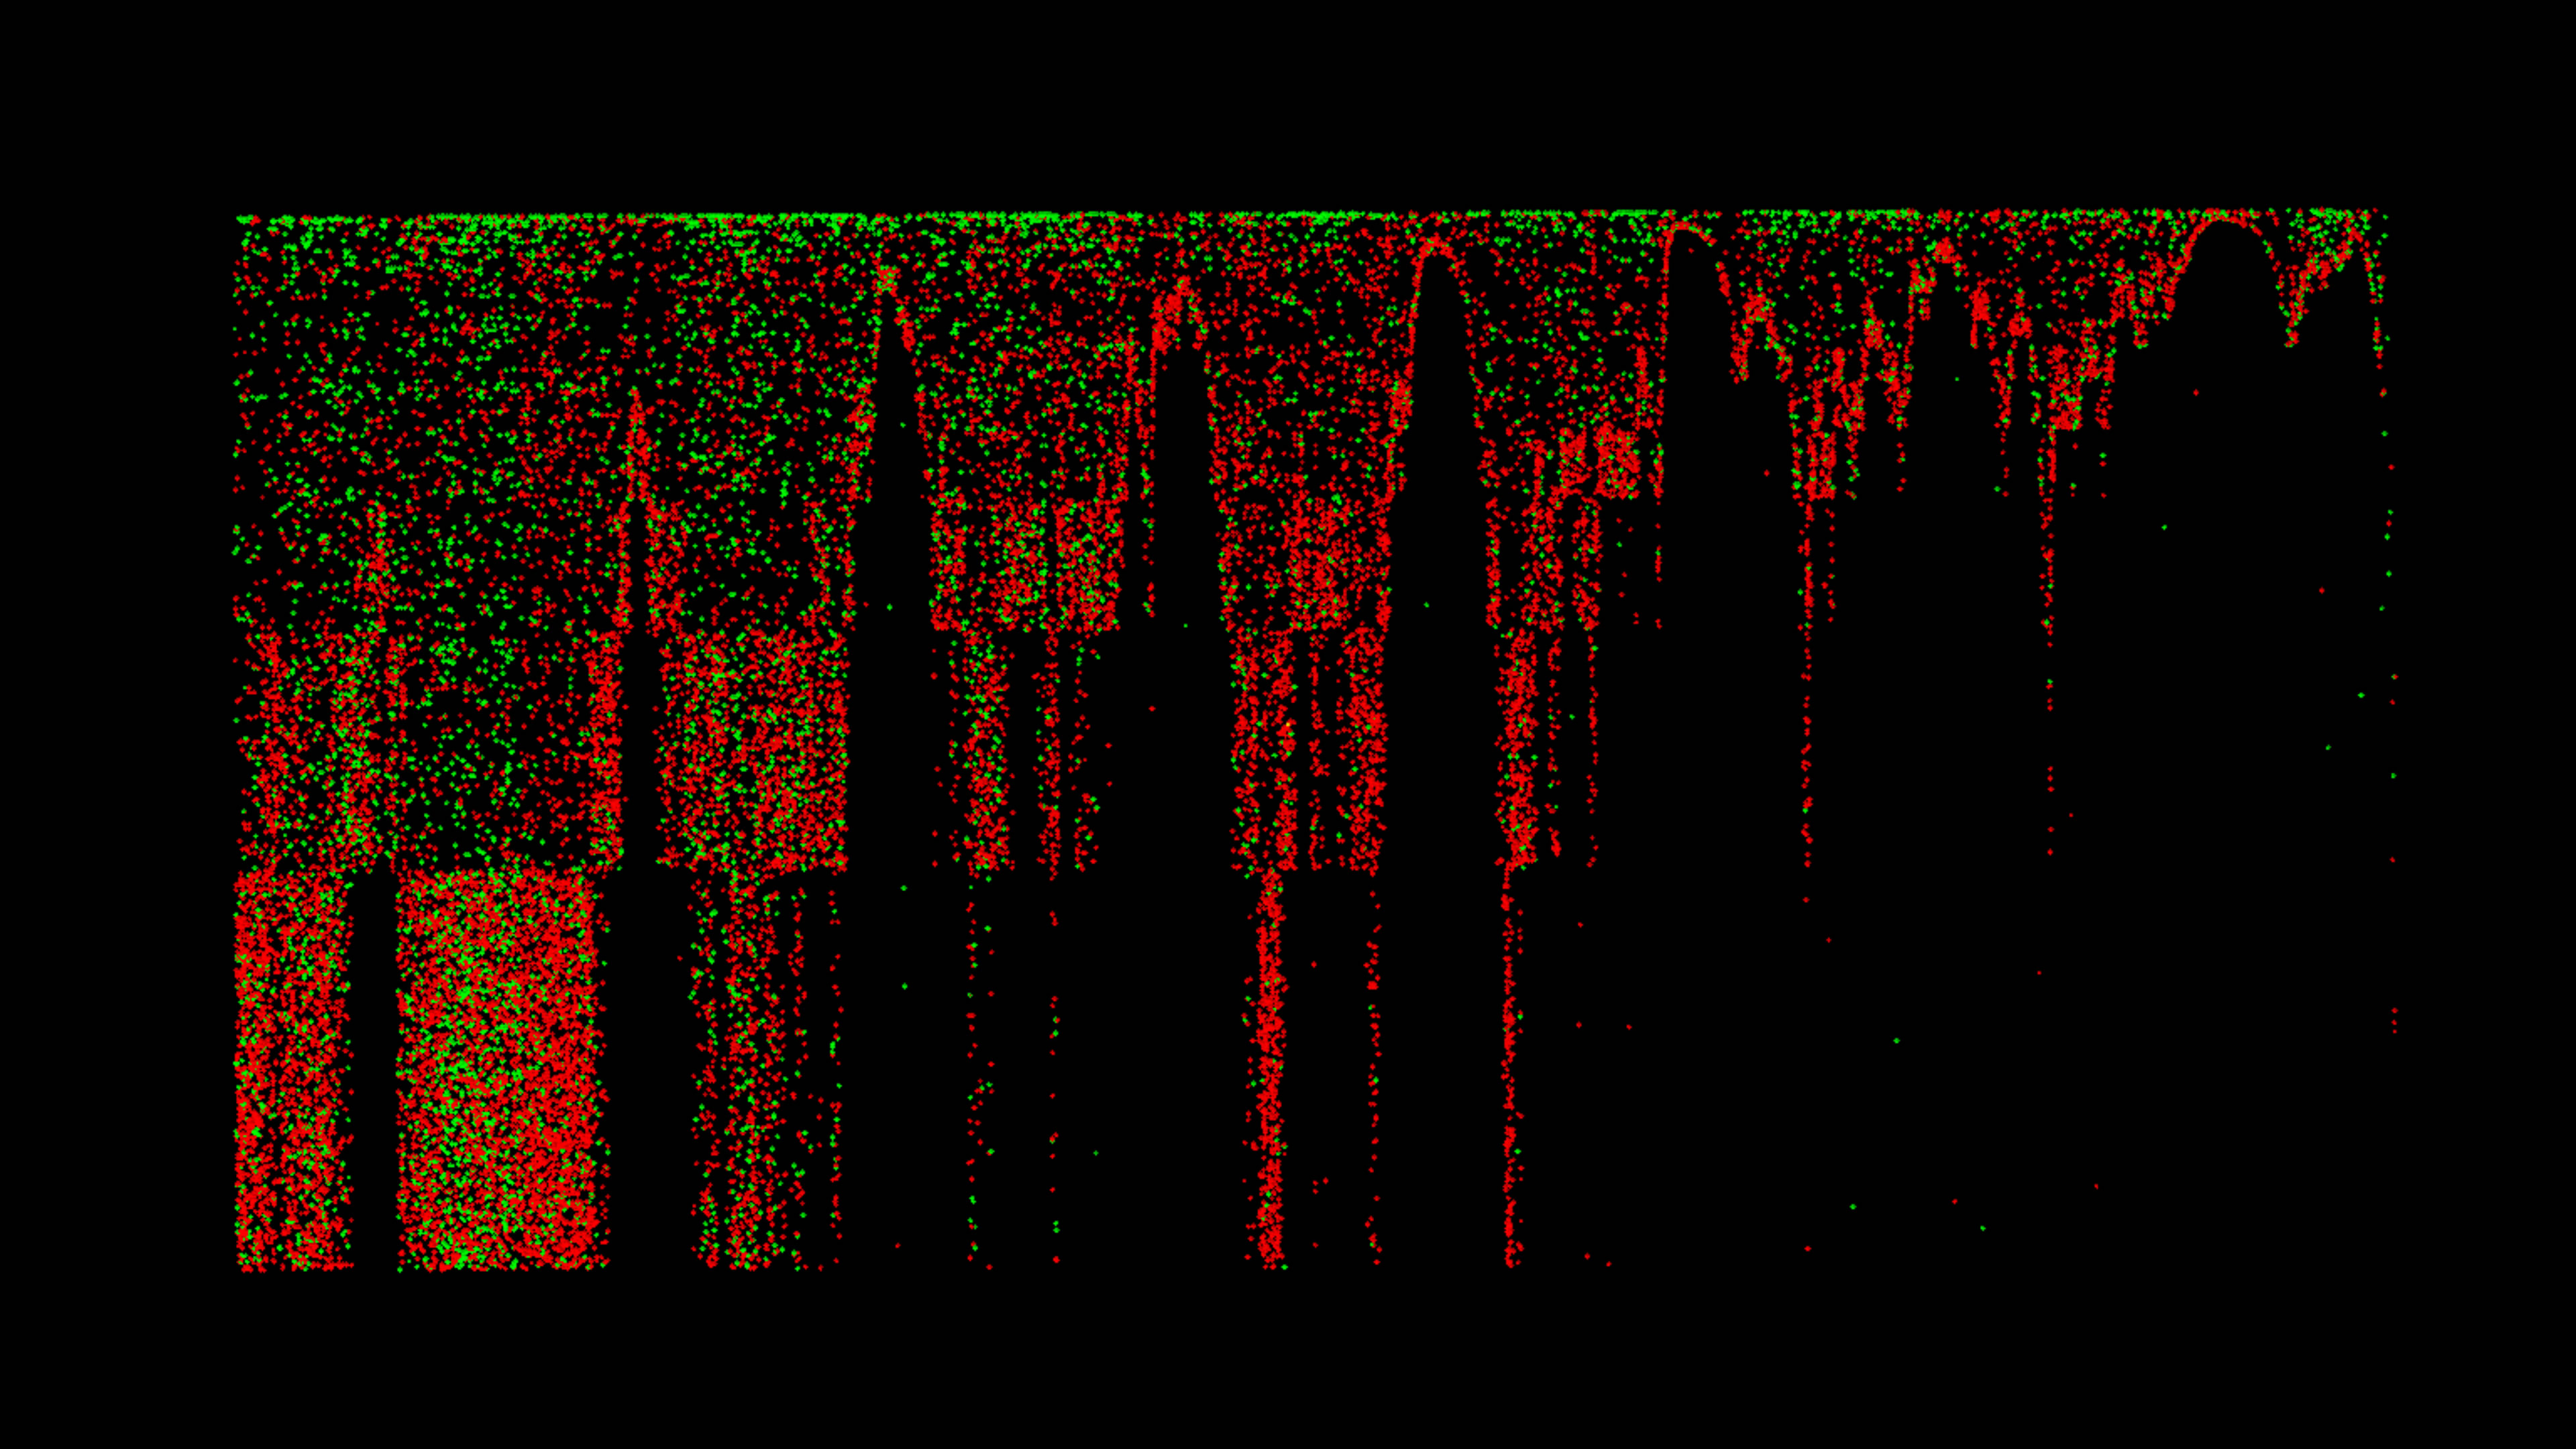
Time vs. Top Tweeters, Duplicate Tweets
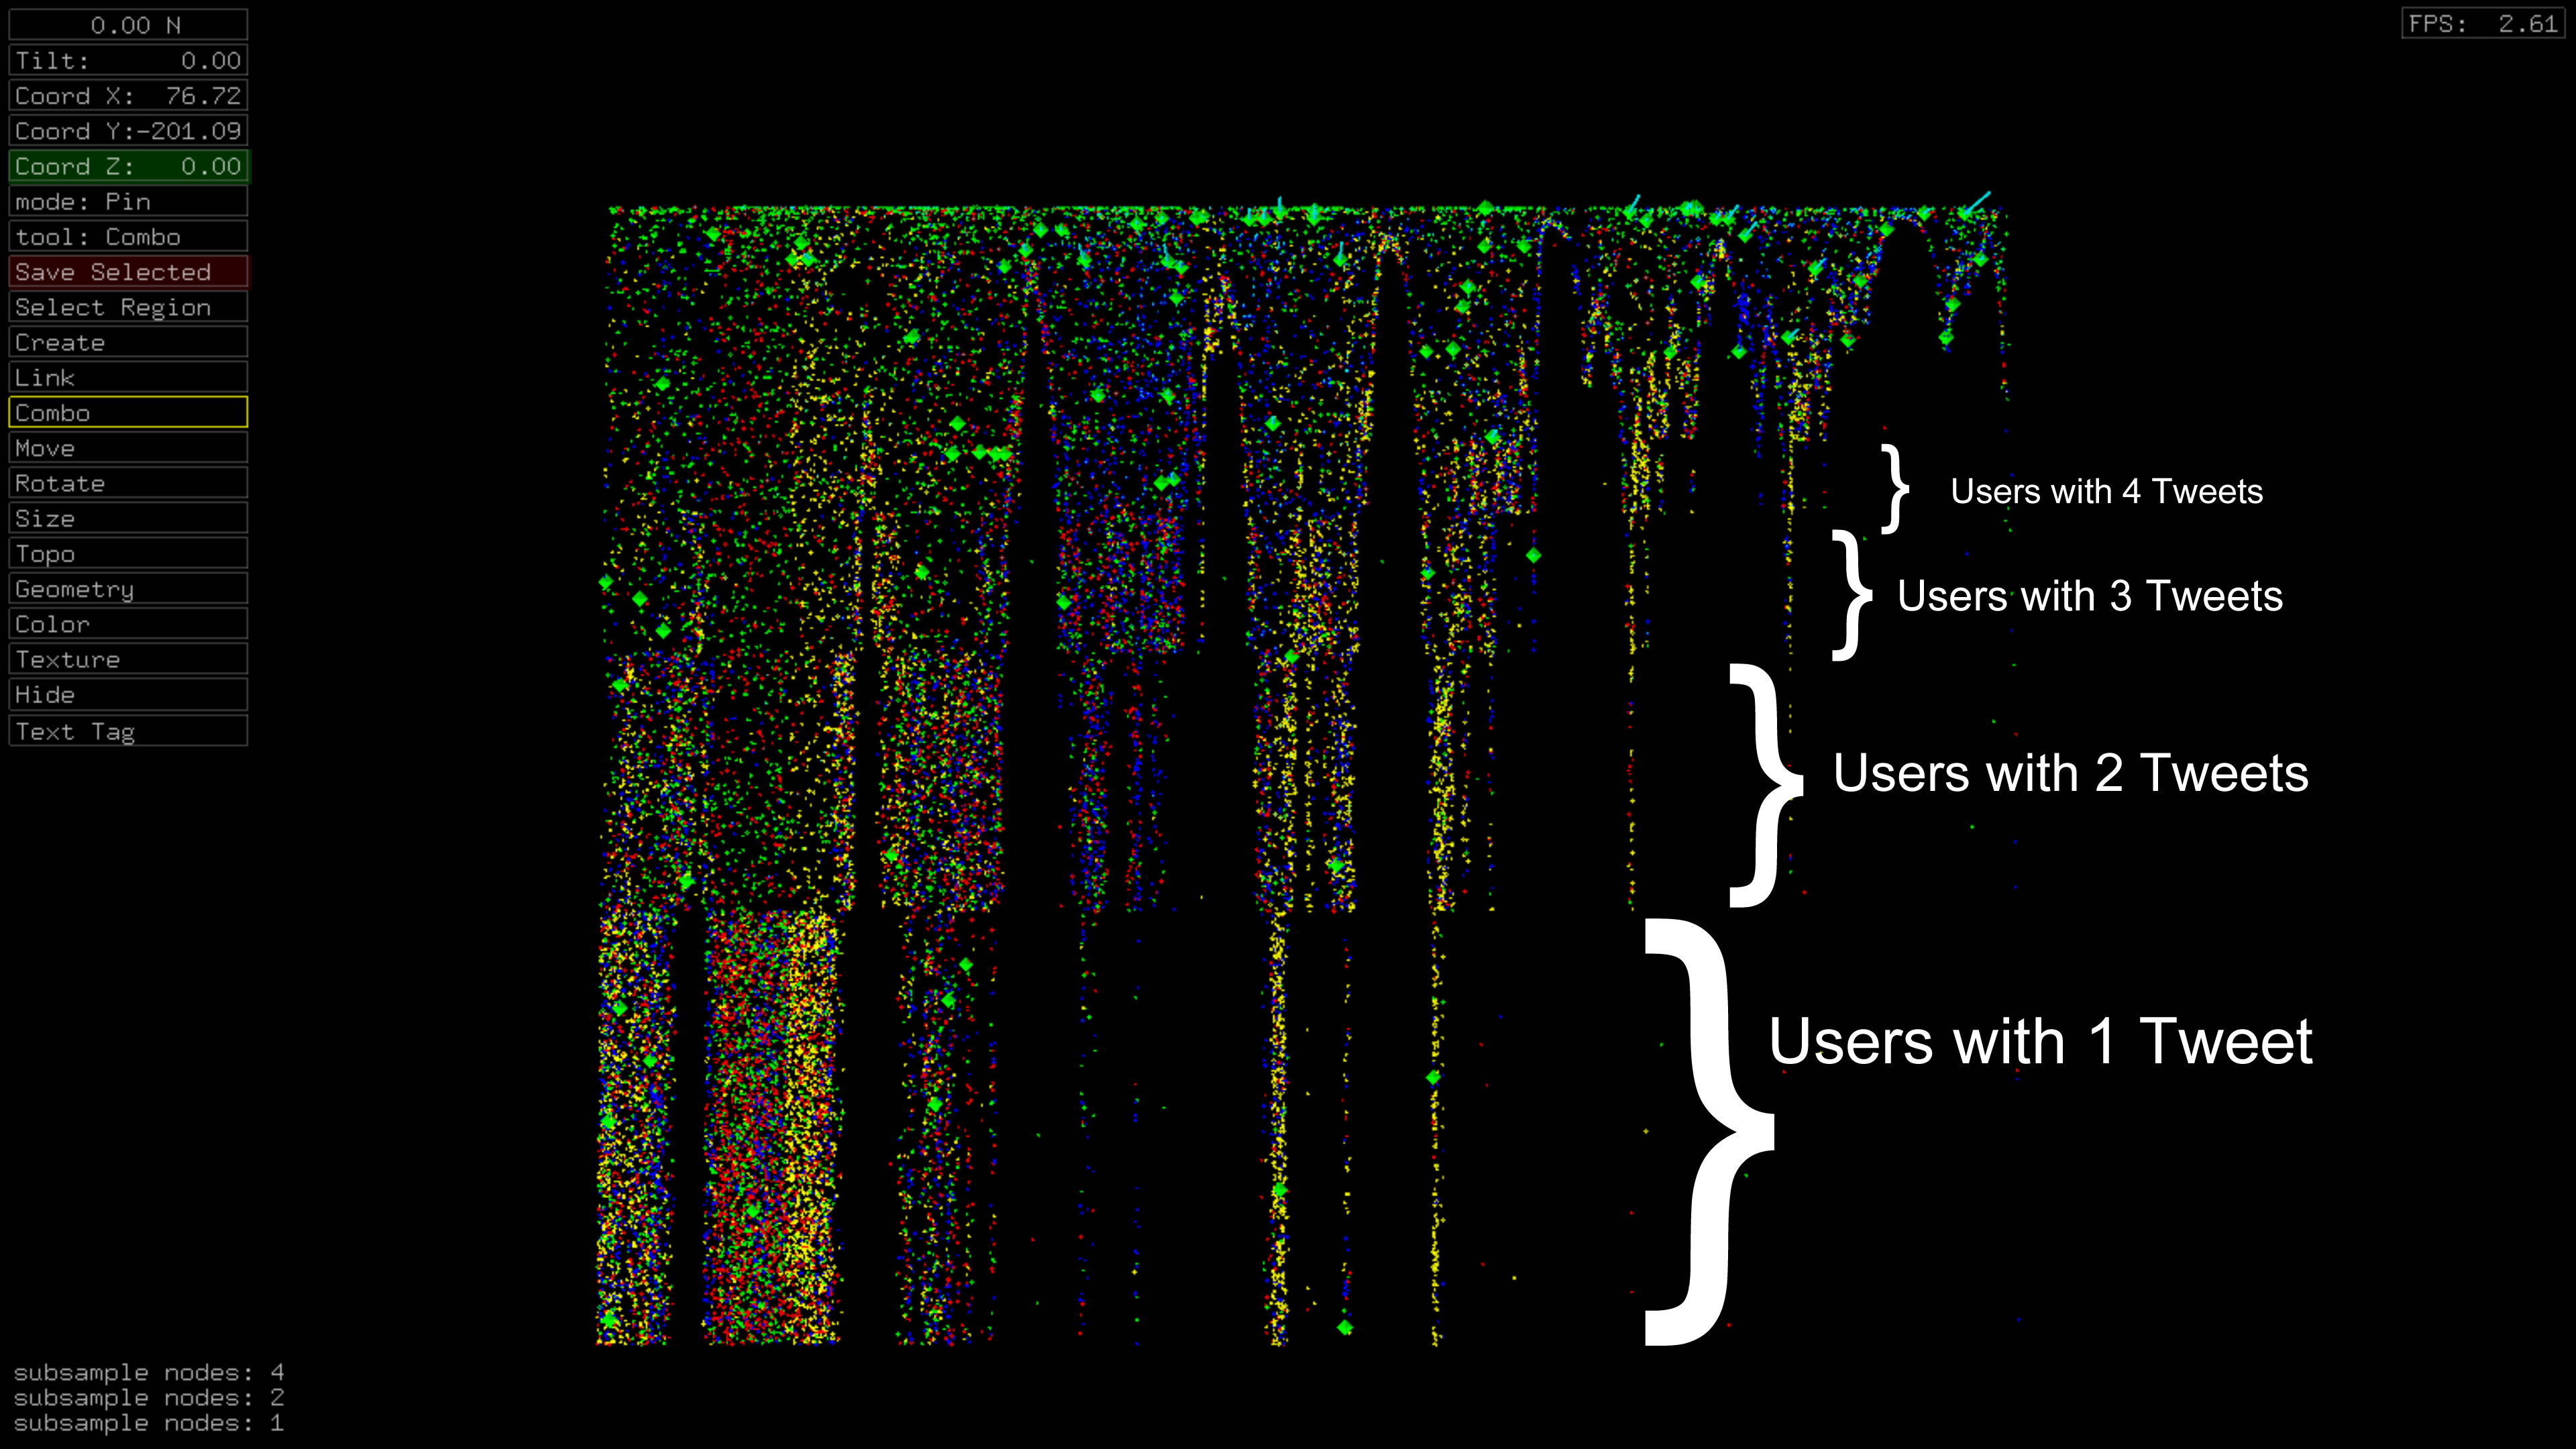
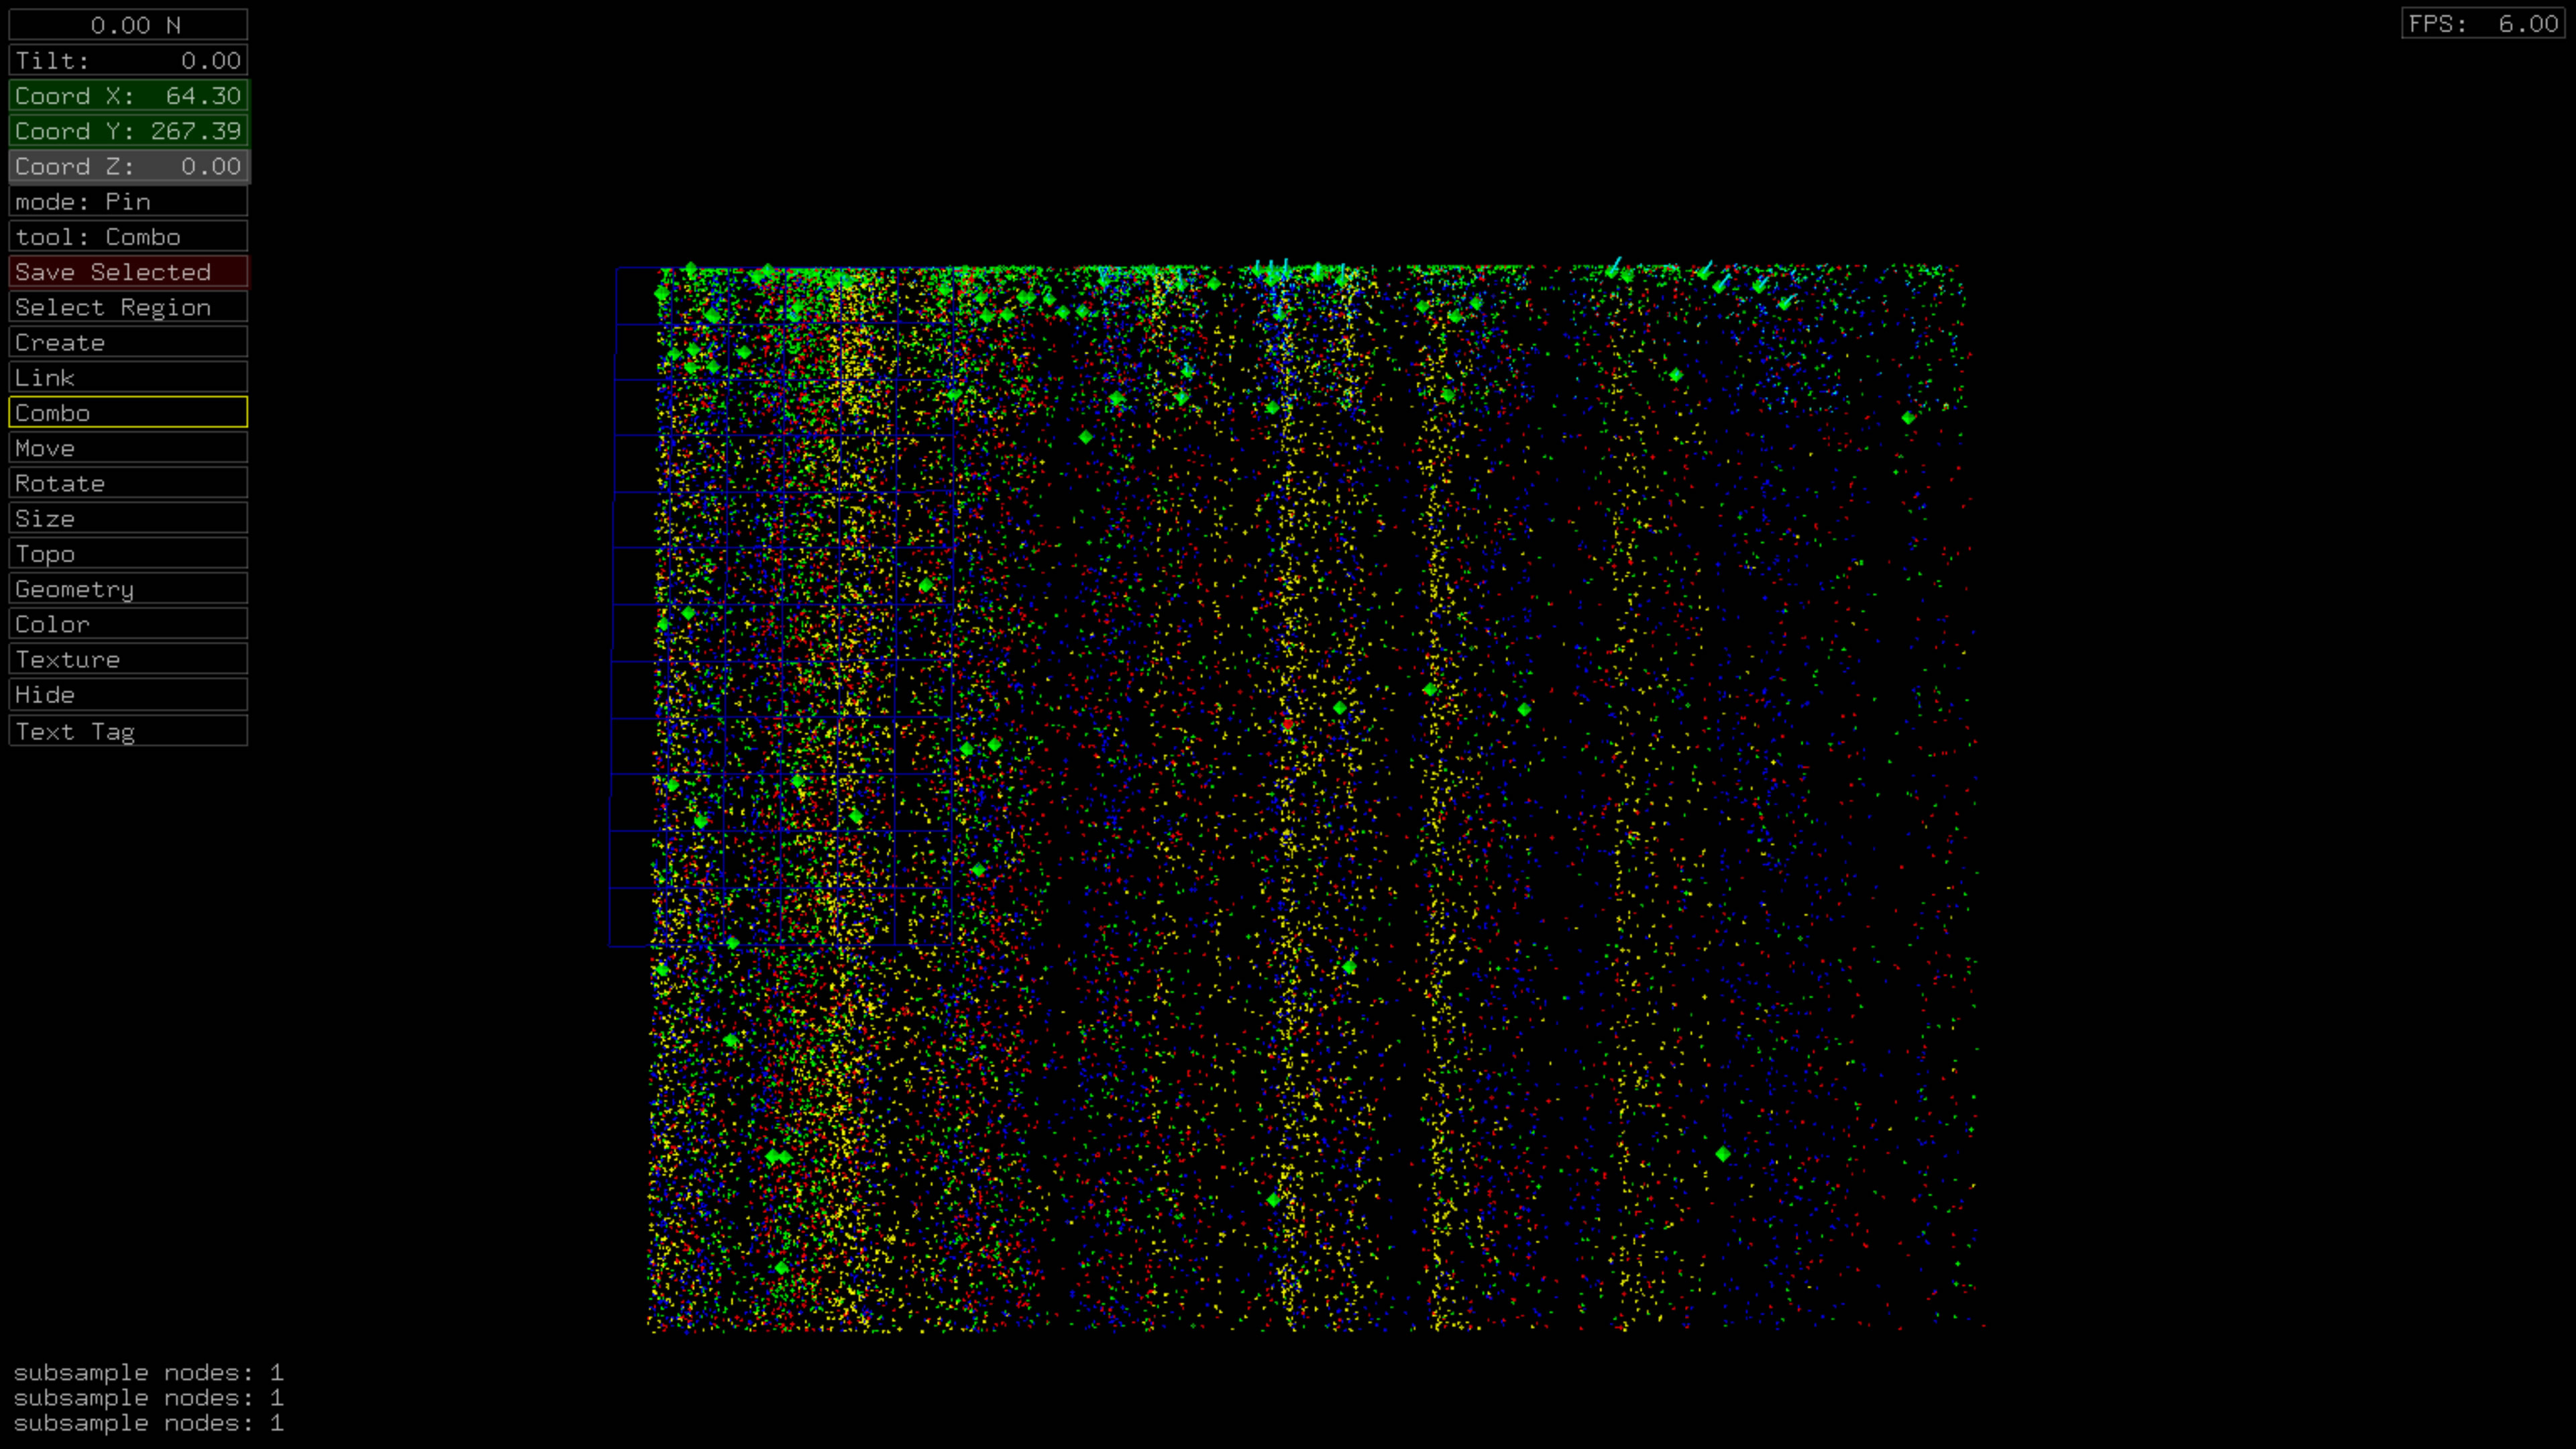
This dataset exhibits some prominent features including distinct user tweet count boundaries, a large burst of retweets of the top 10 most retweeted tweets, gaps distinctly bounded by retweets of top 10 tweets.
Download ANTz visualization of time vs. top tweeters for Windows.
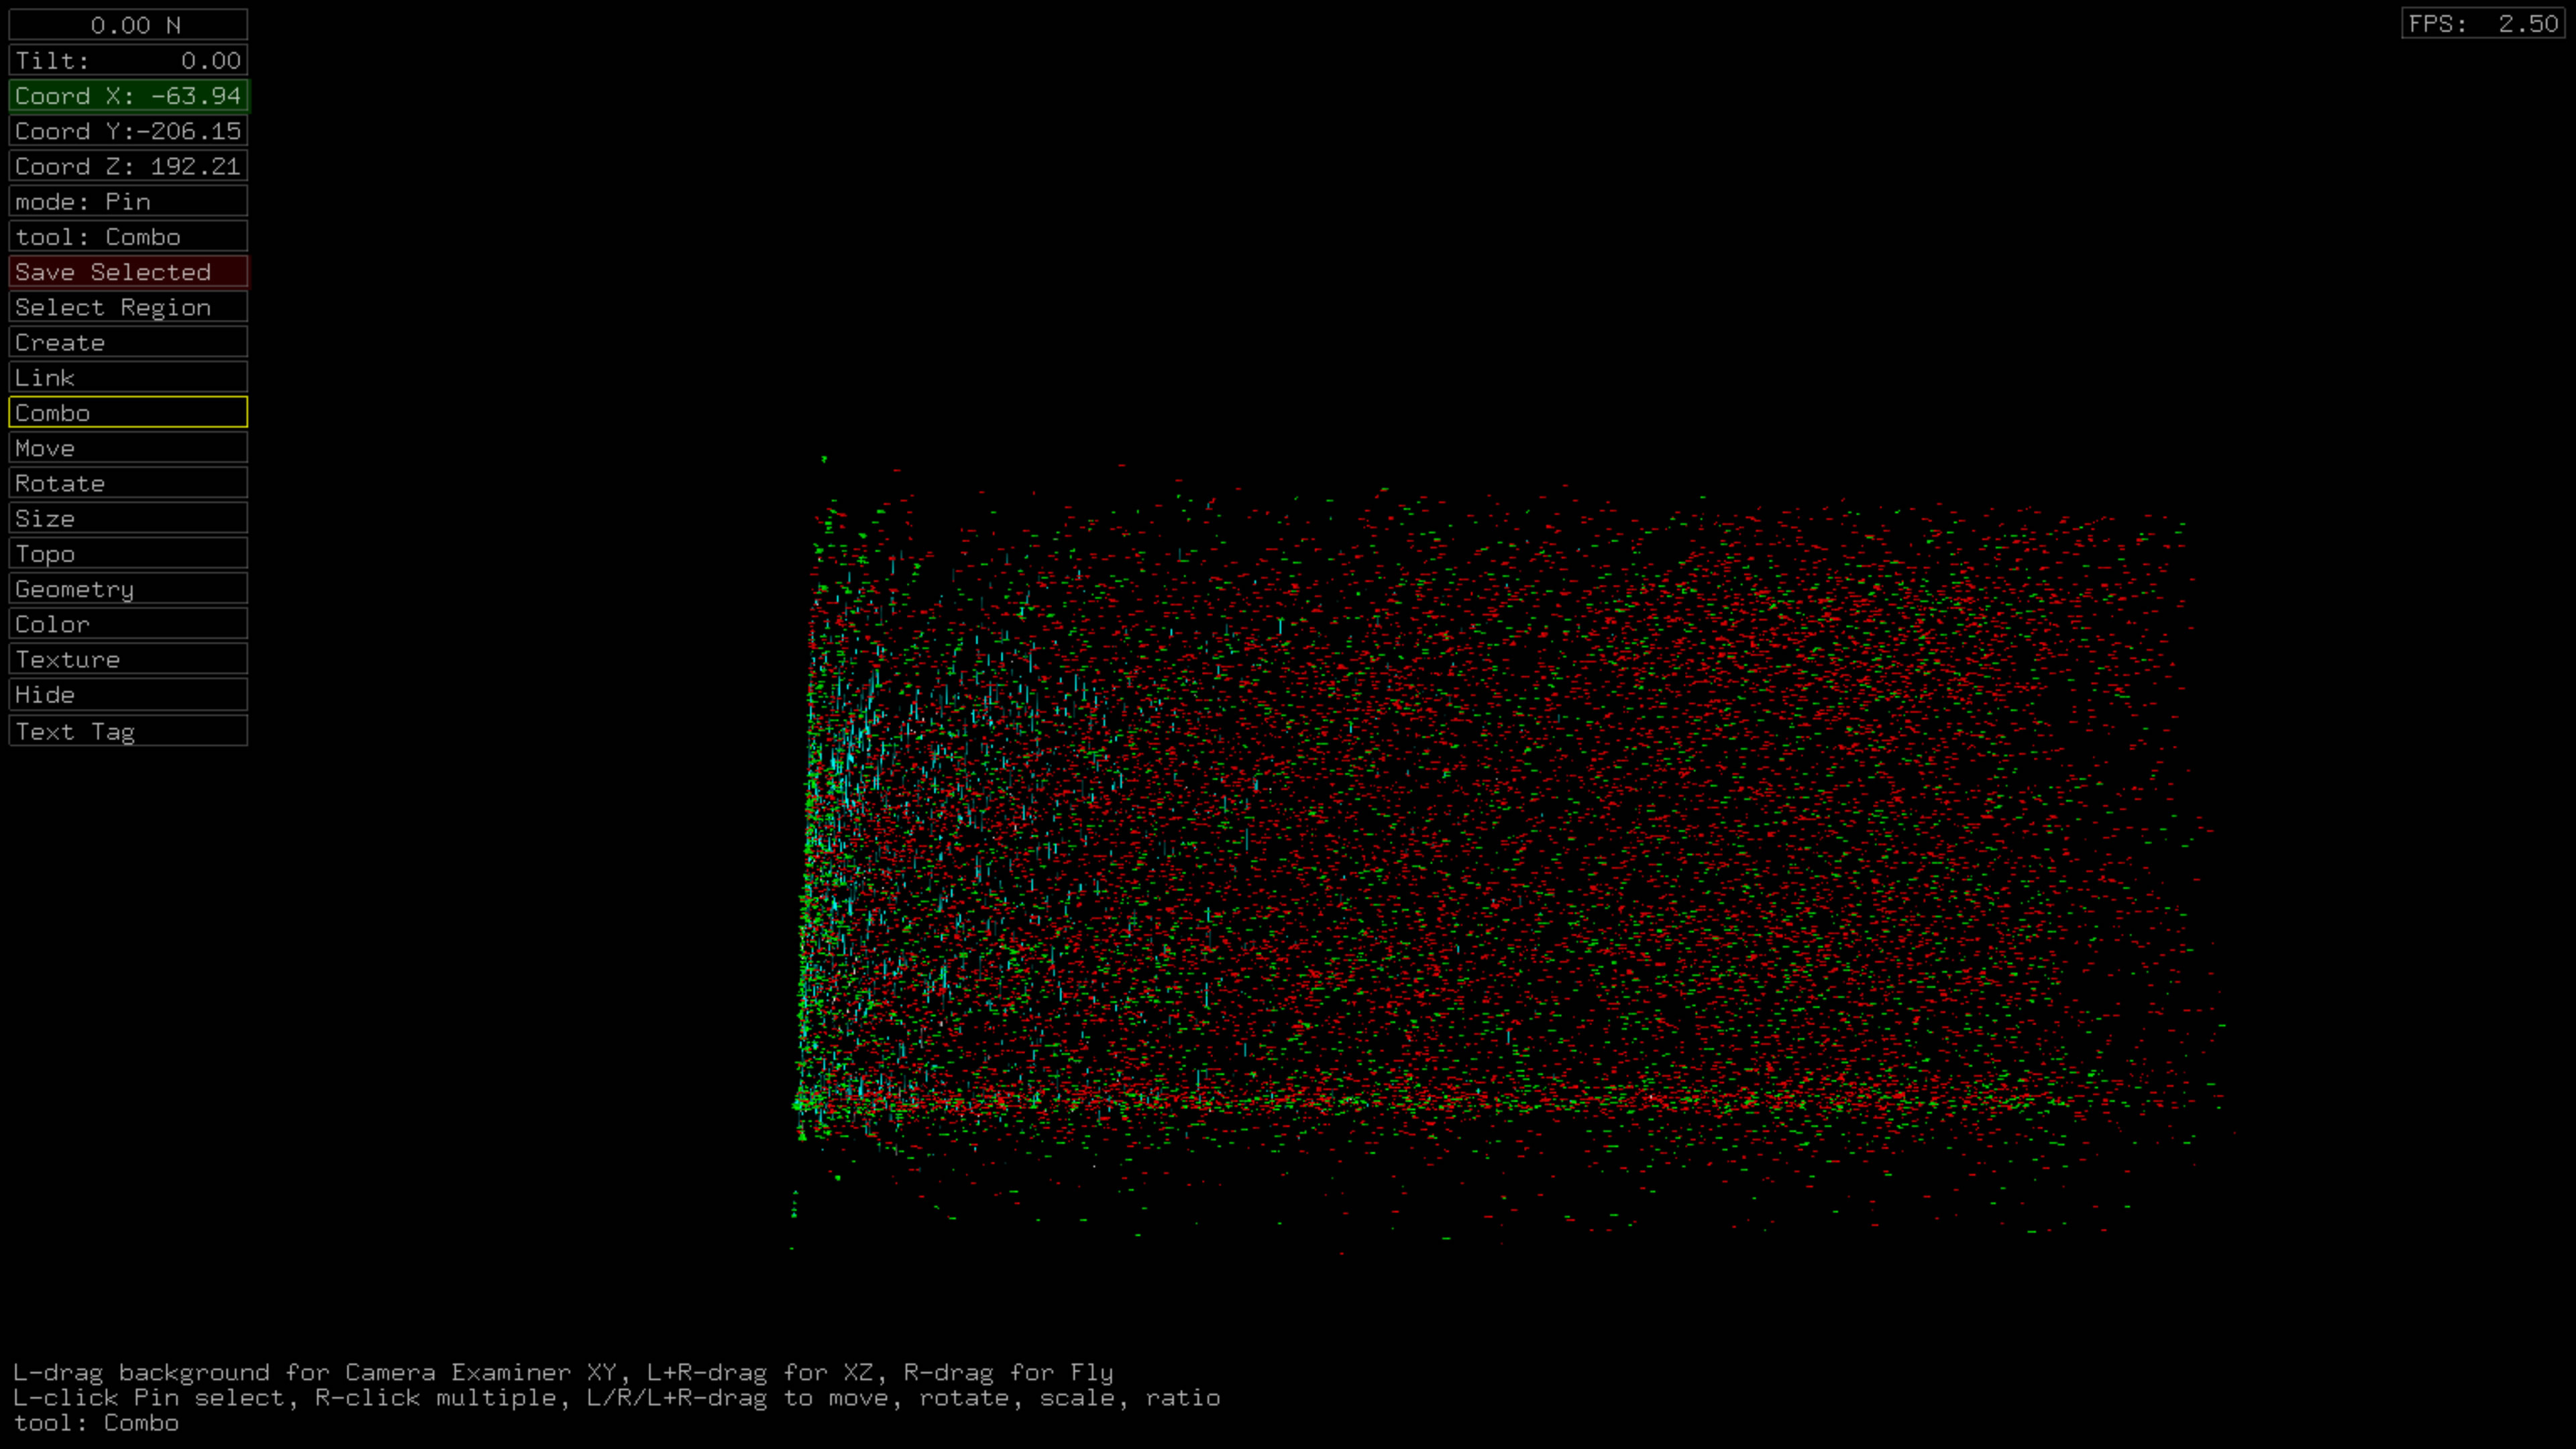
Time vs. Top Tweeters, Unique Tweets
Download ANTz visualization of time vs. top tweeters for Windows.
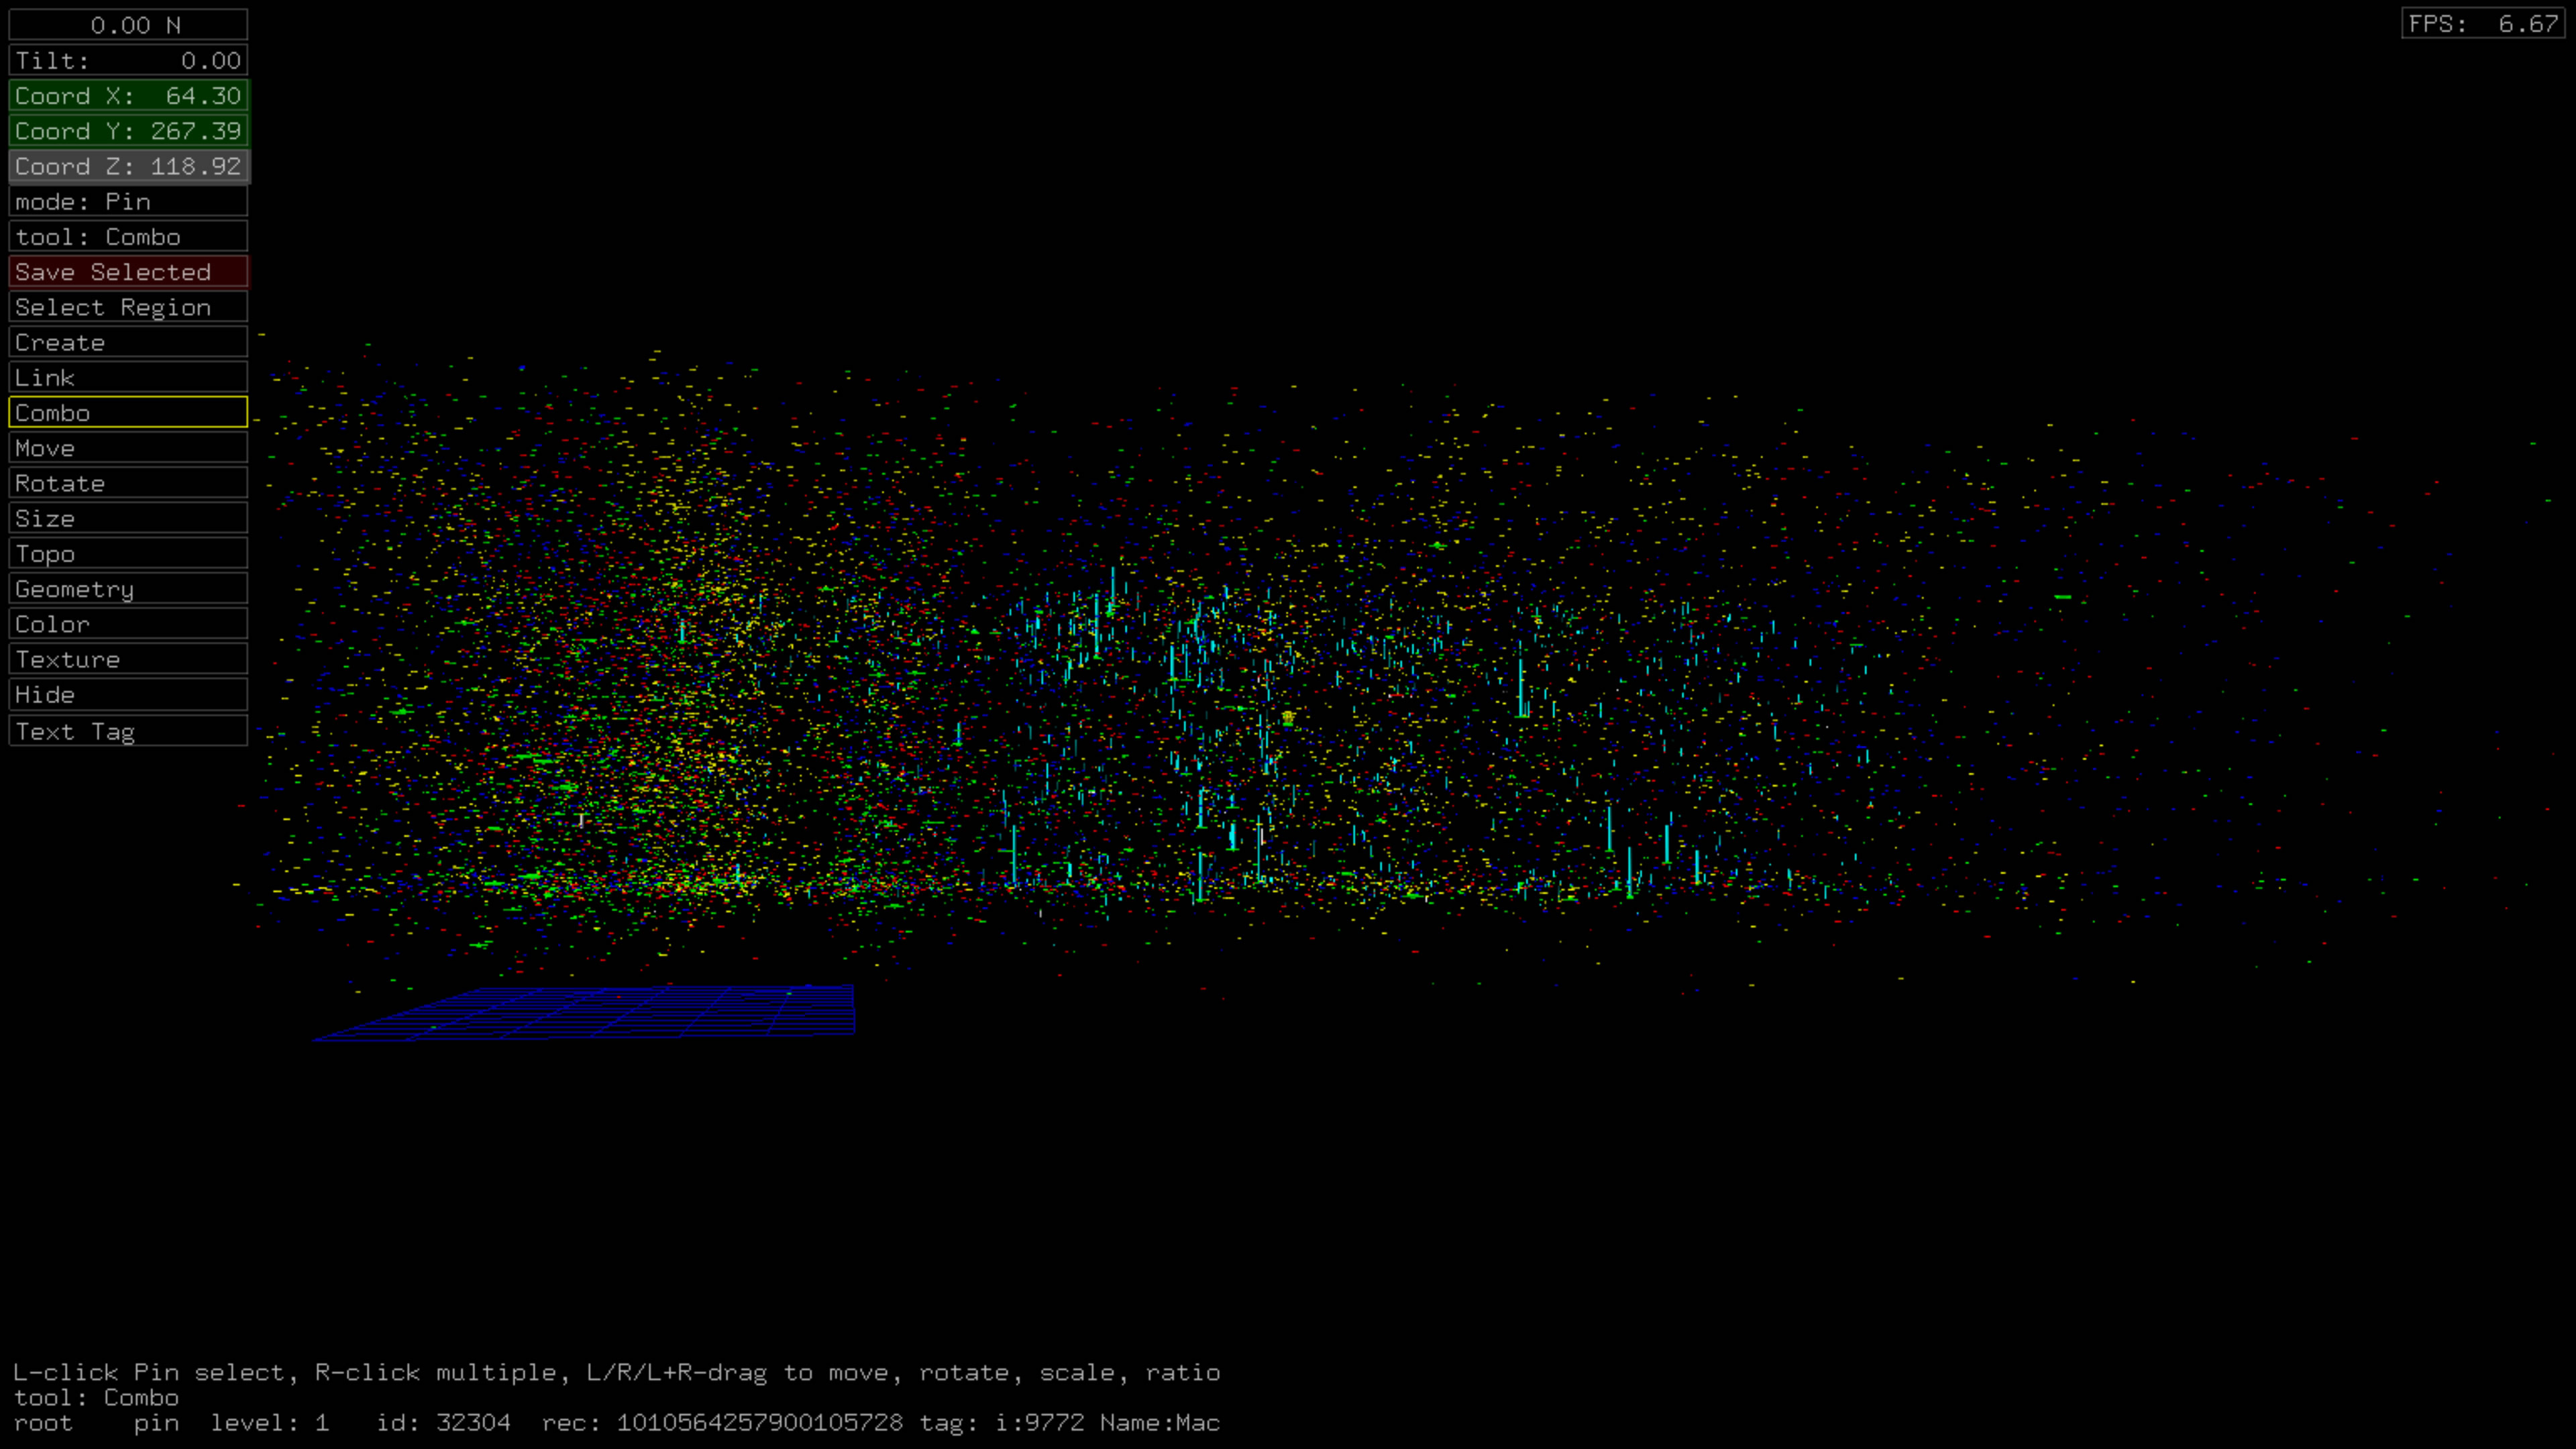
Rendering only unique tweets gives a more homogeneous distribution as would normally be expected.
