Data Collection
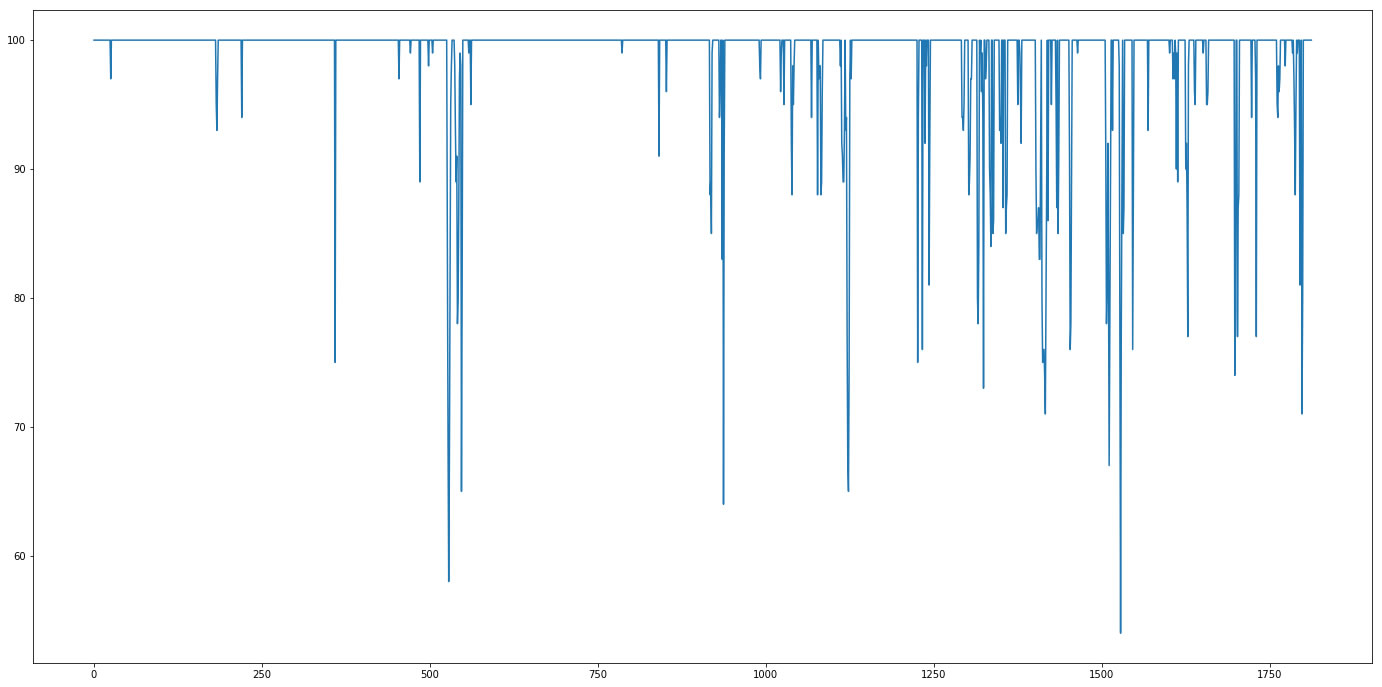
Data was collected for ~19 days, May 17, 6:30pm through June 5, 10:45am. Data was sampled using the Twitter Search API once every 15 minutes, 96 samples per day, 1814 total samples, 179004 total tweets (some duplicates), 52877 unique user accounts. Each sample requested the maximum number of tweets allowed for free which is 100 tweets. Some samples fell short of this maximum (see figure for Tweet Counts Per Sample). Tweet data was saved as text files in json format.
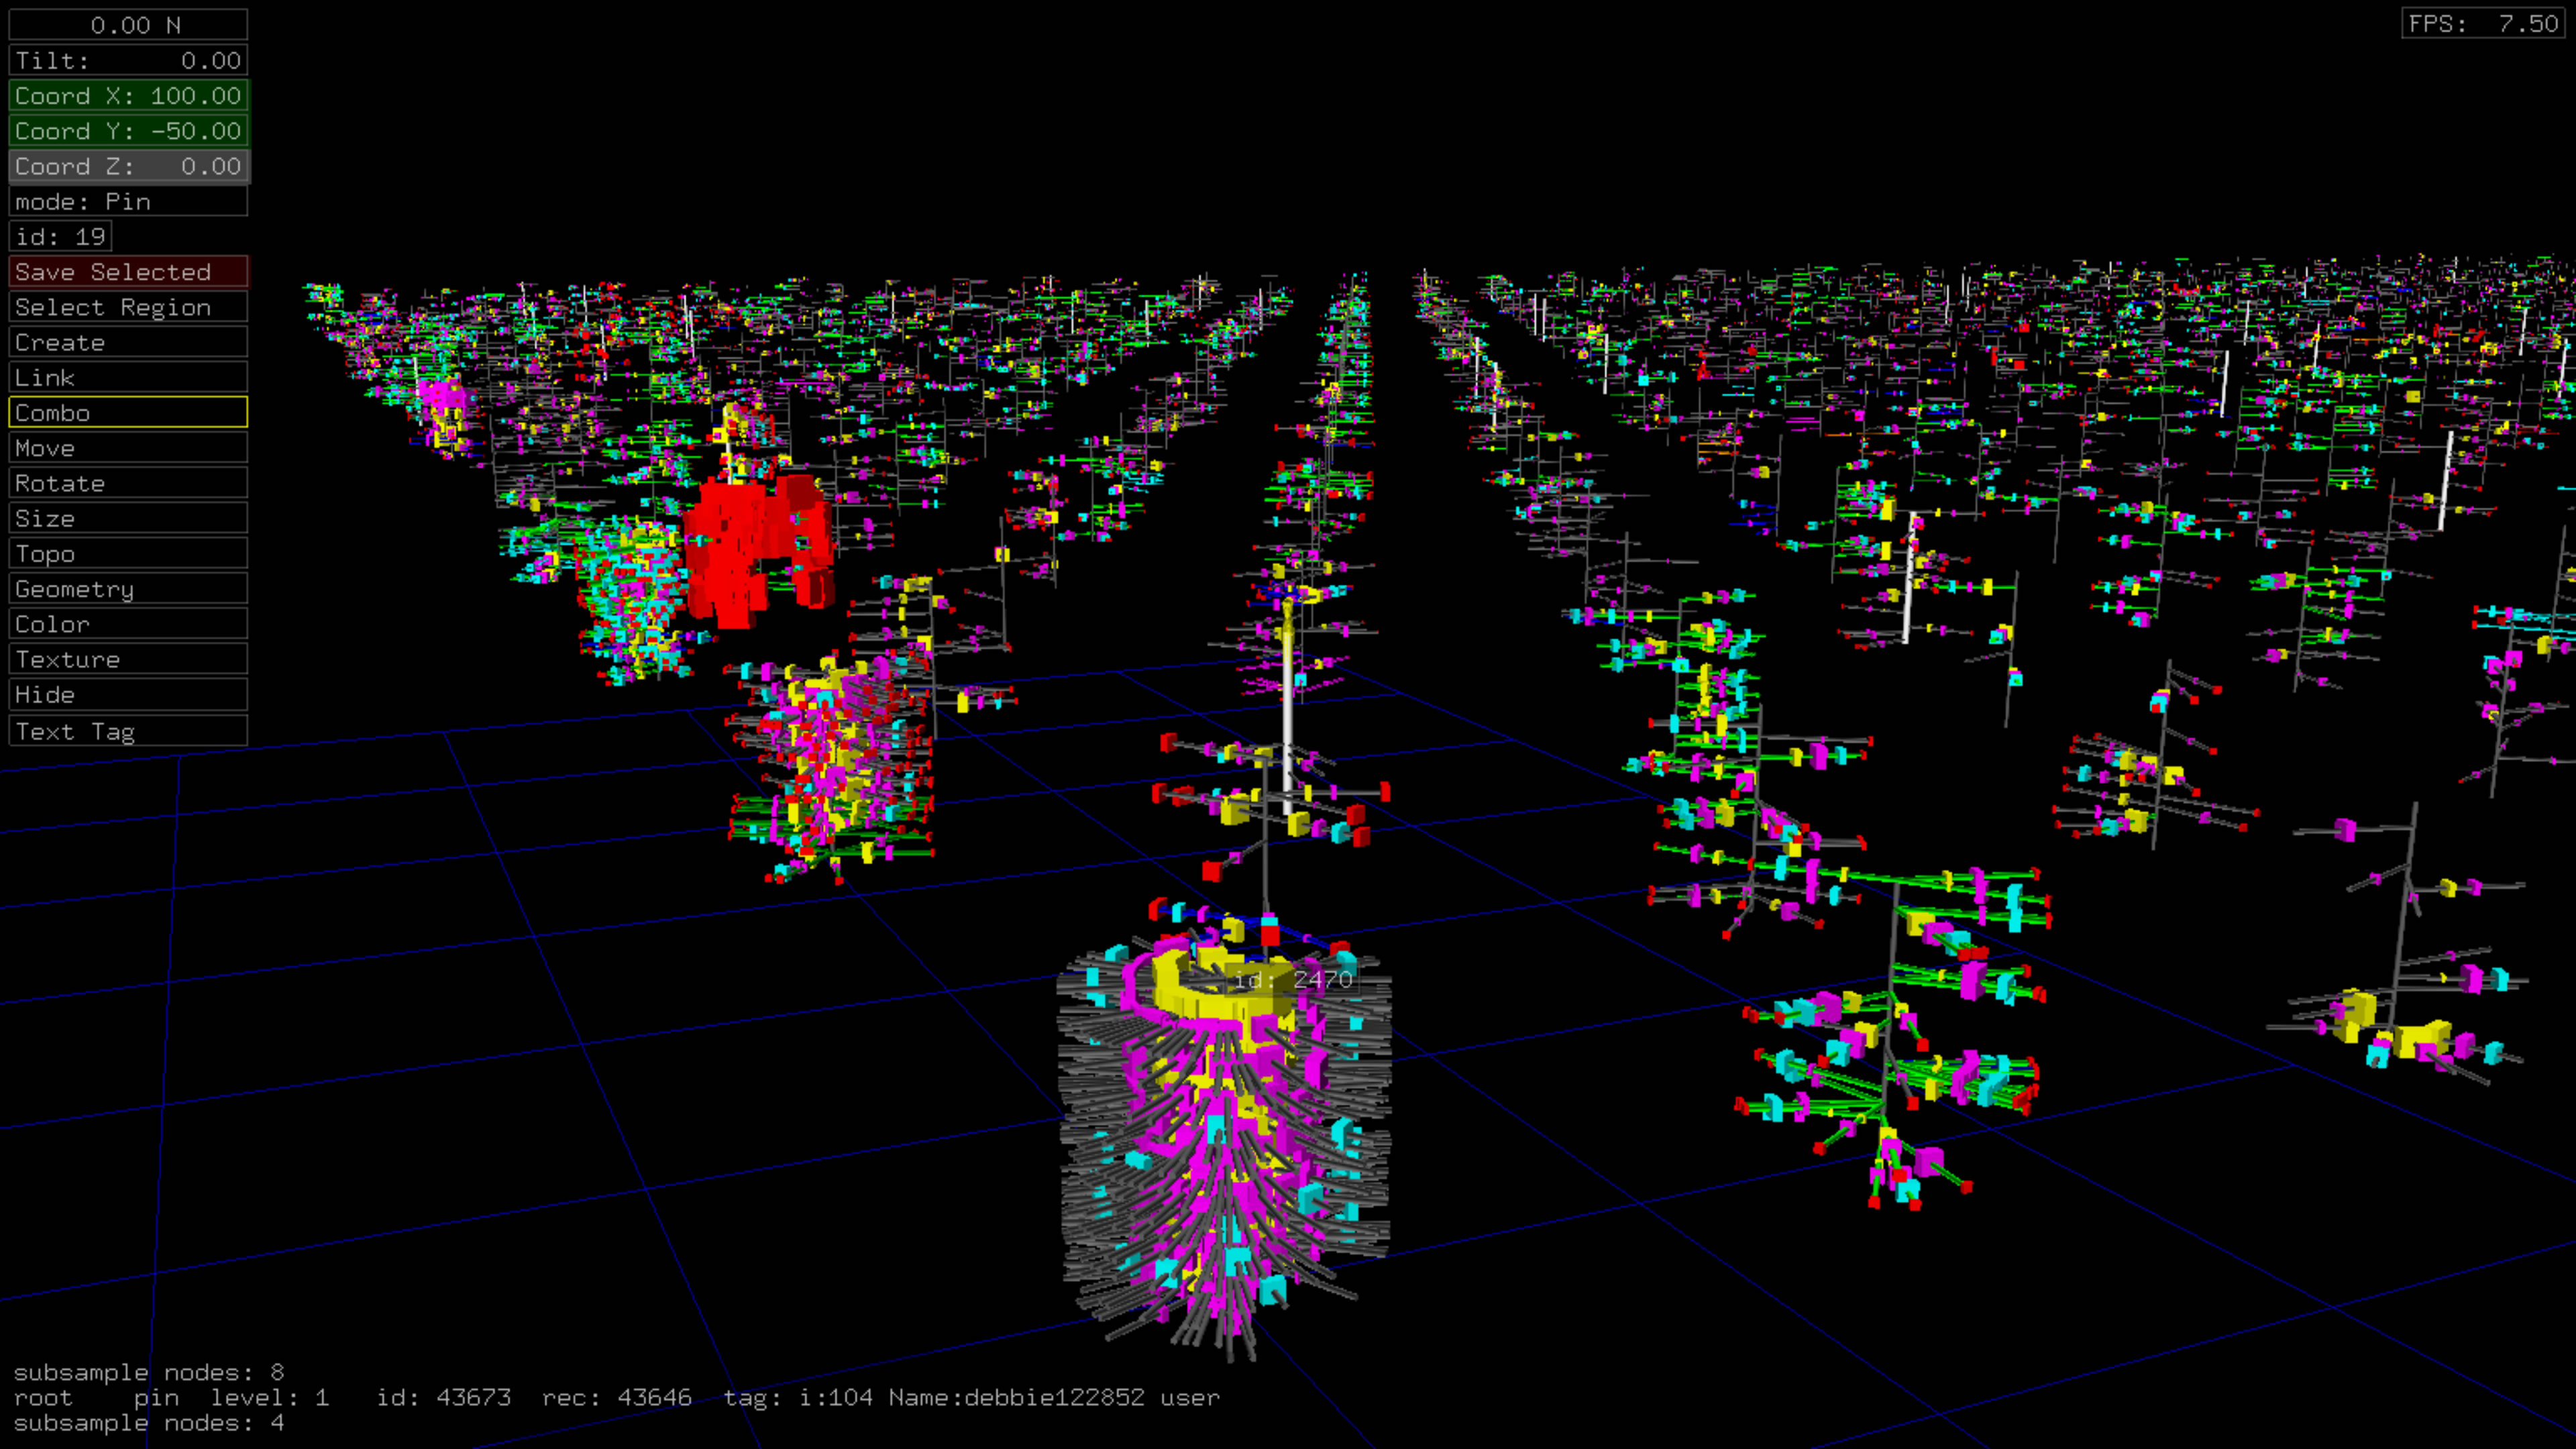
User Daily Tweet Behavior Glyph
Download ANTz Visualization for Windows
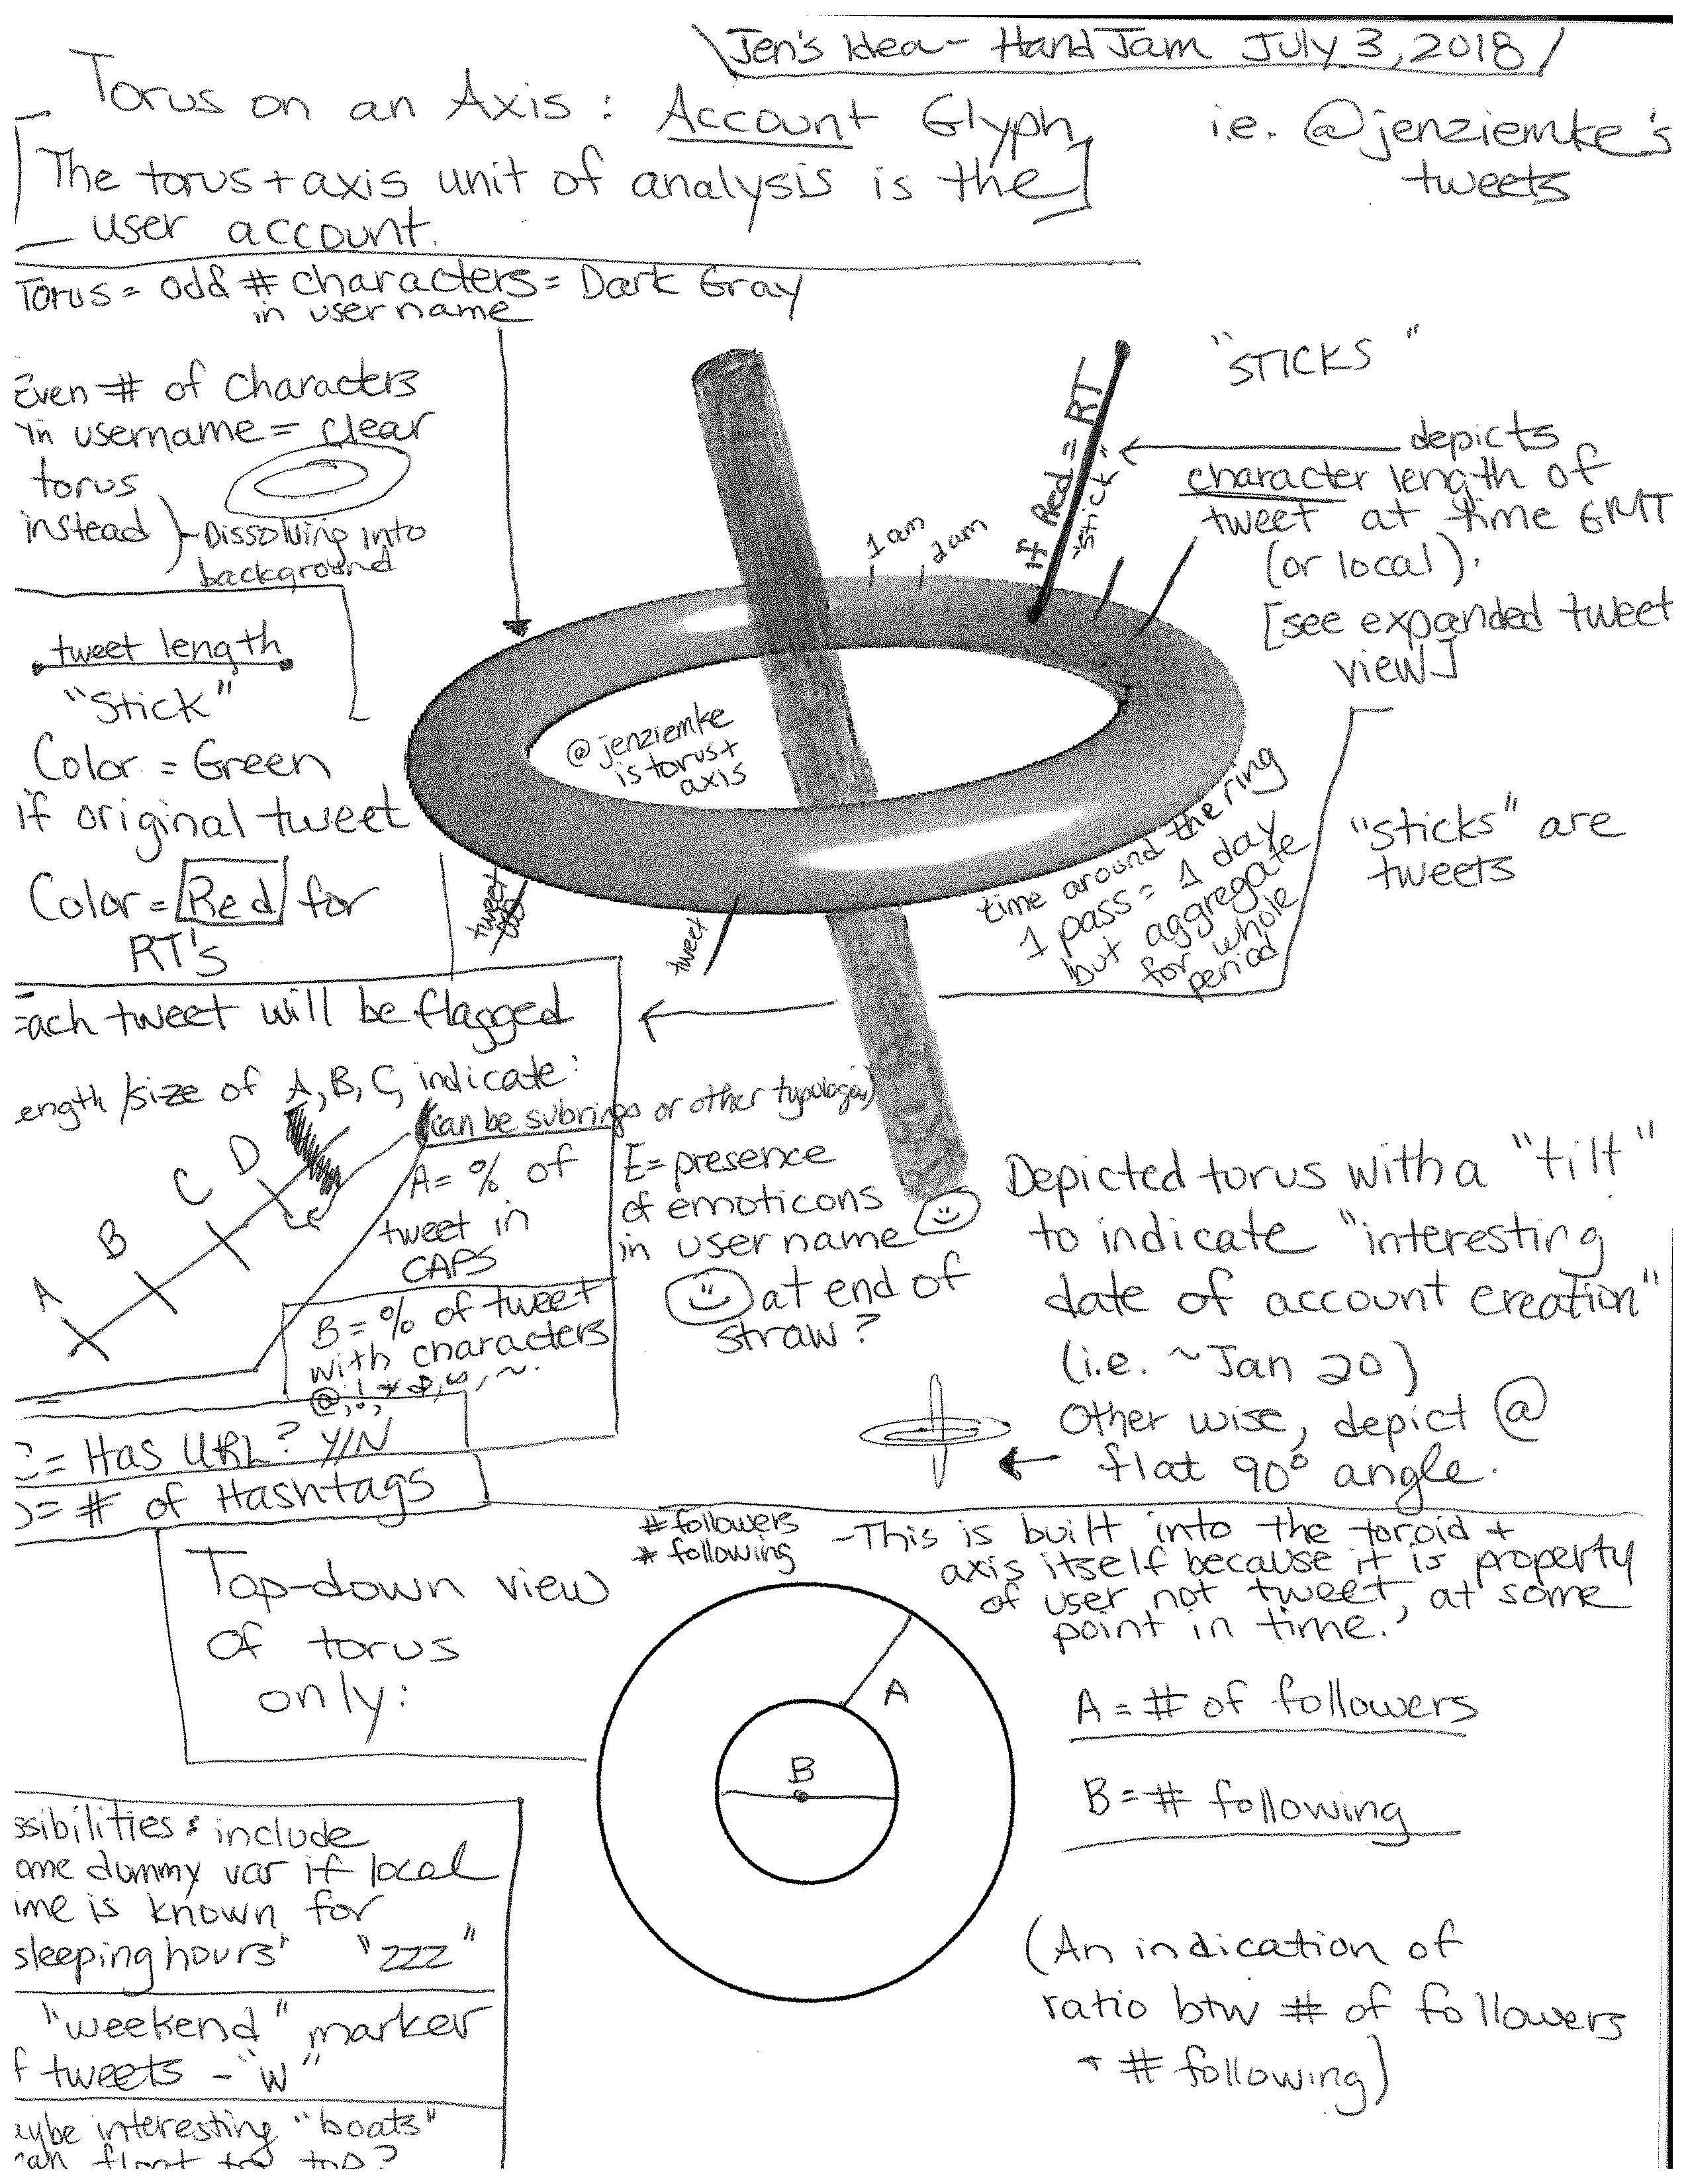
The images below are based on a glyph design developed by Jen Zeimke and Jeff Sale. The original design is shown below:
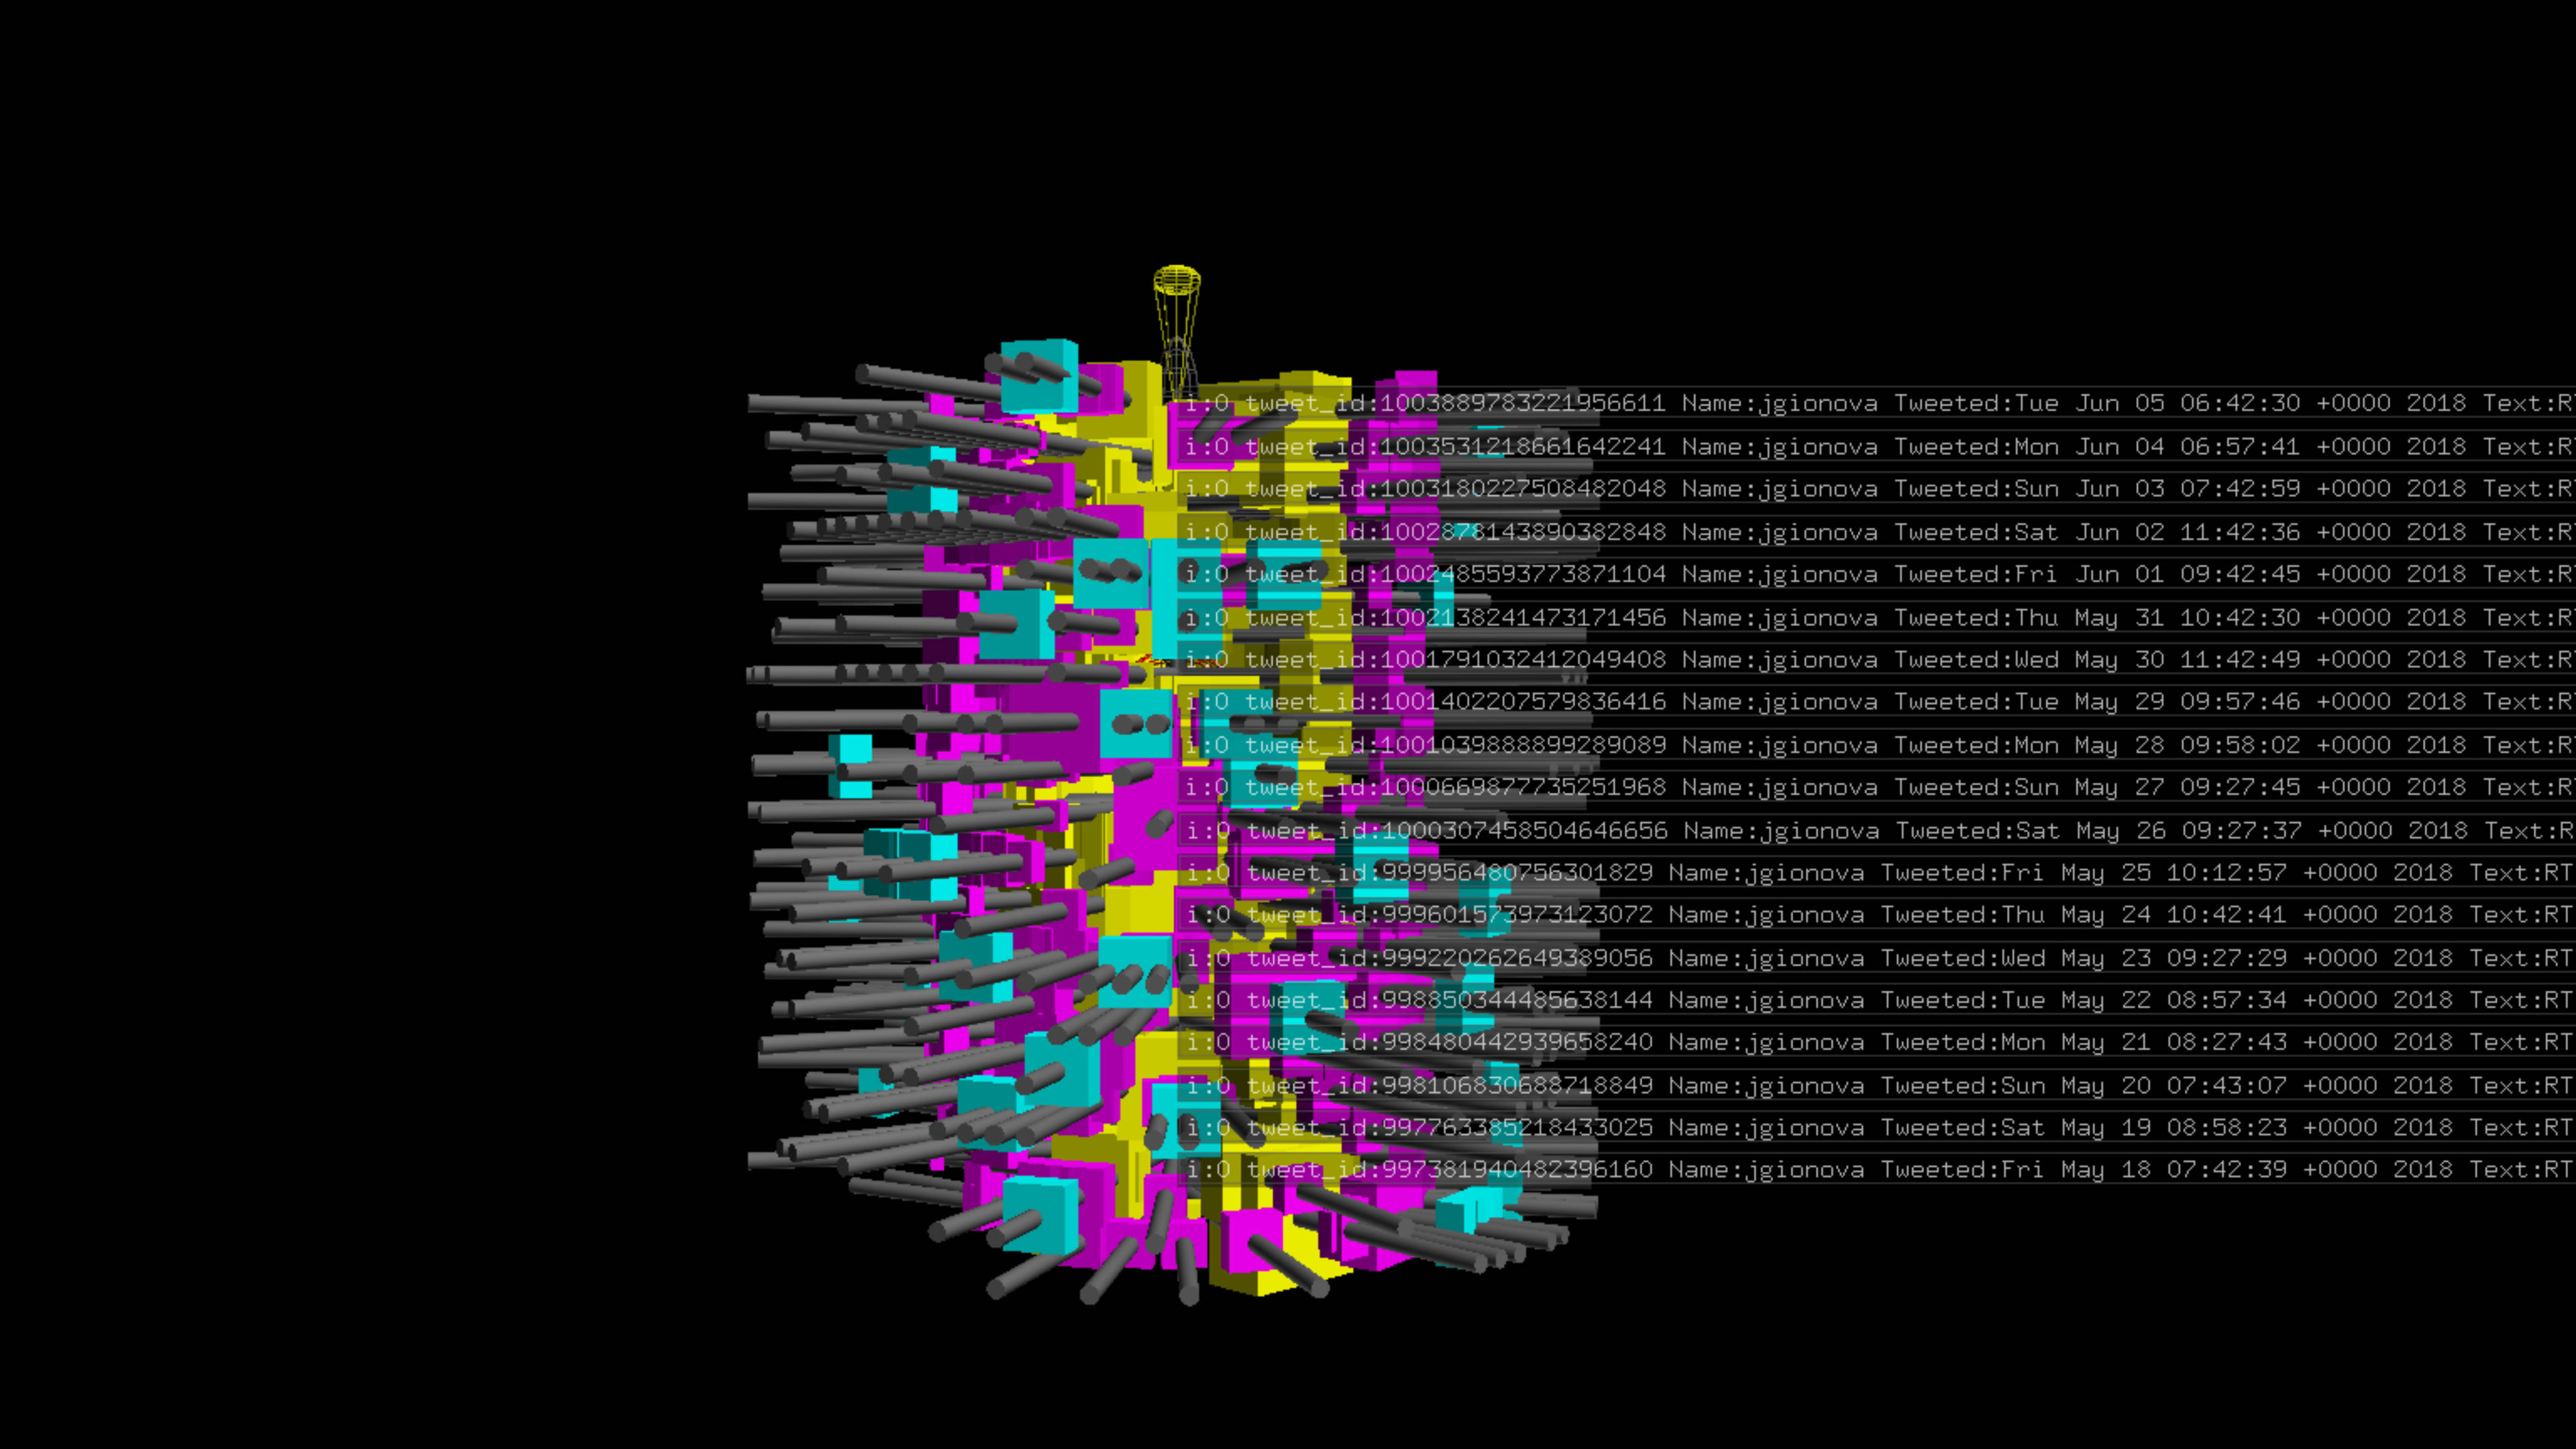
This design was modified to include spokes representing individual tweets. The central axis which was intended to represent user creation date was either replaced by a colored sphere or removed entirely.
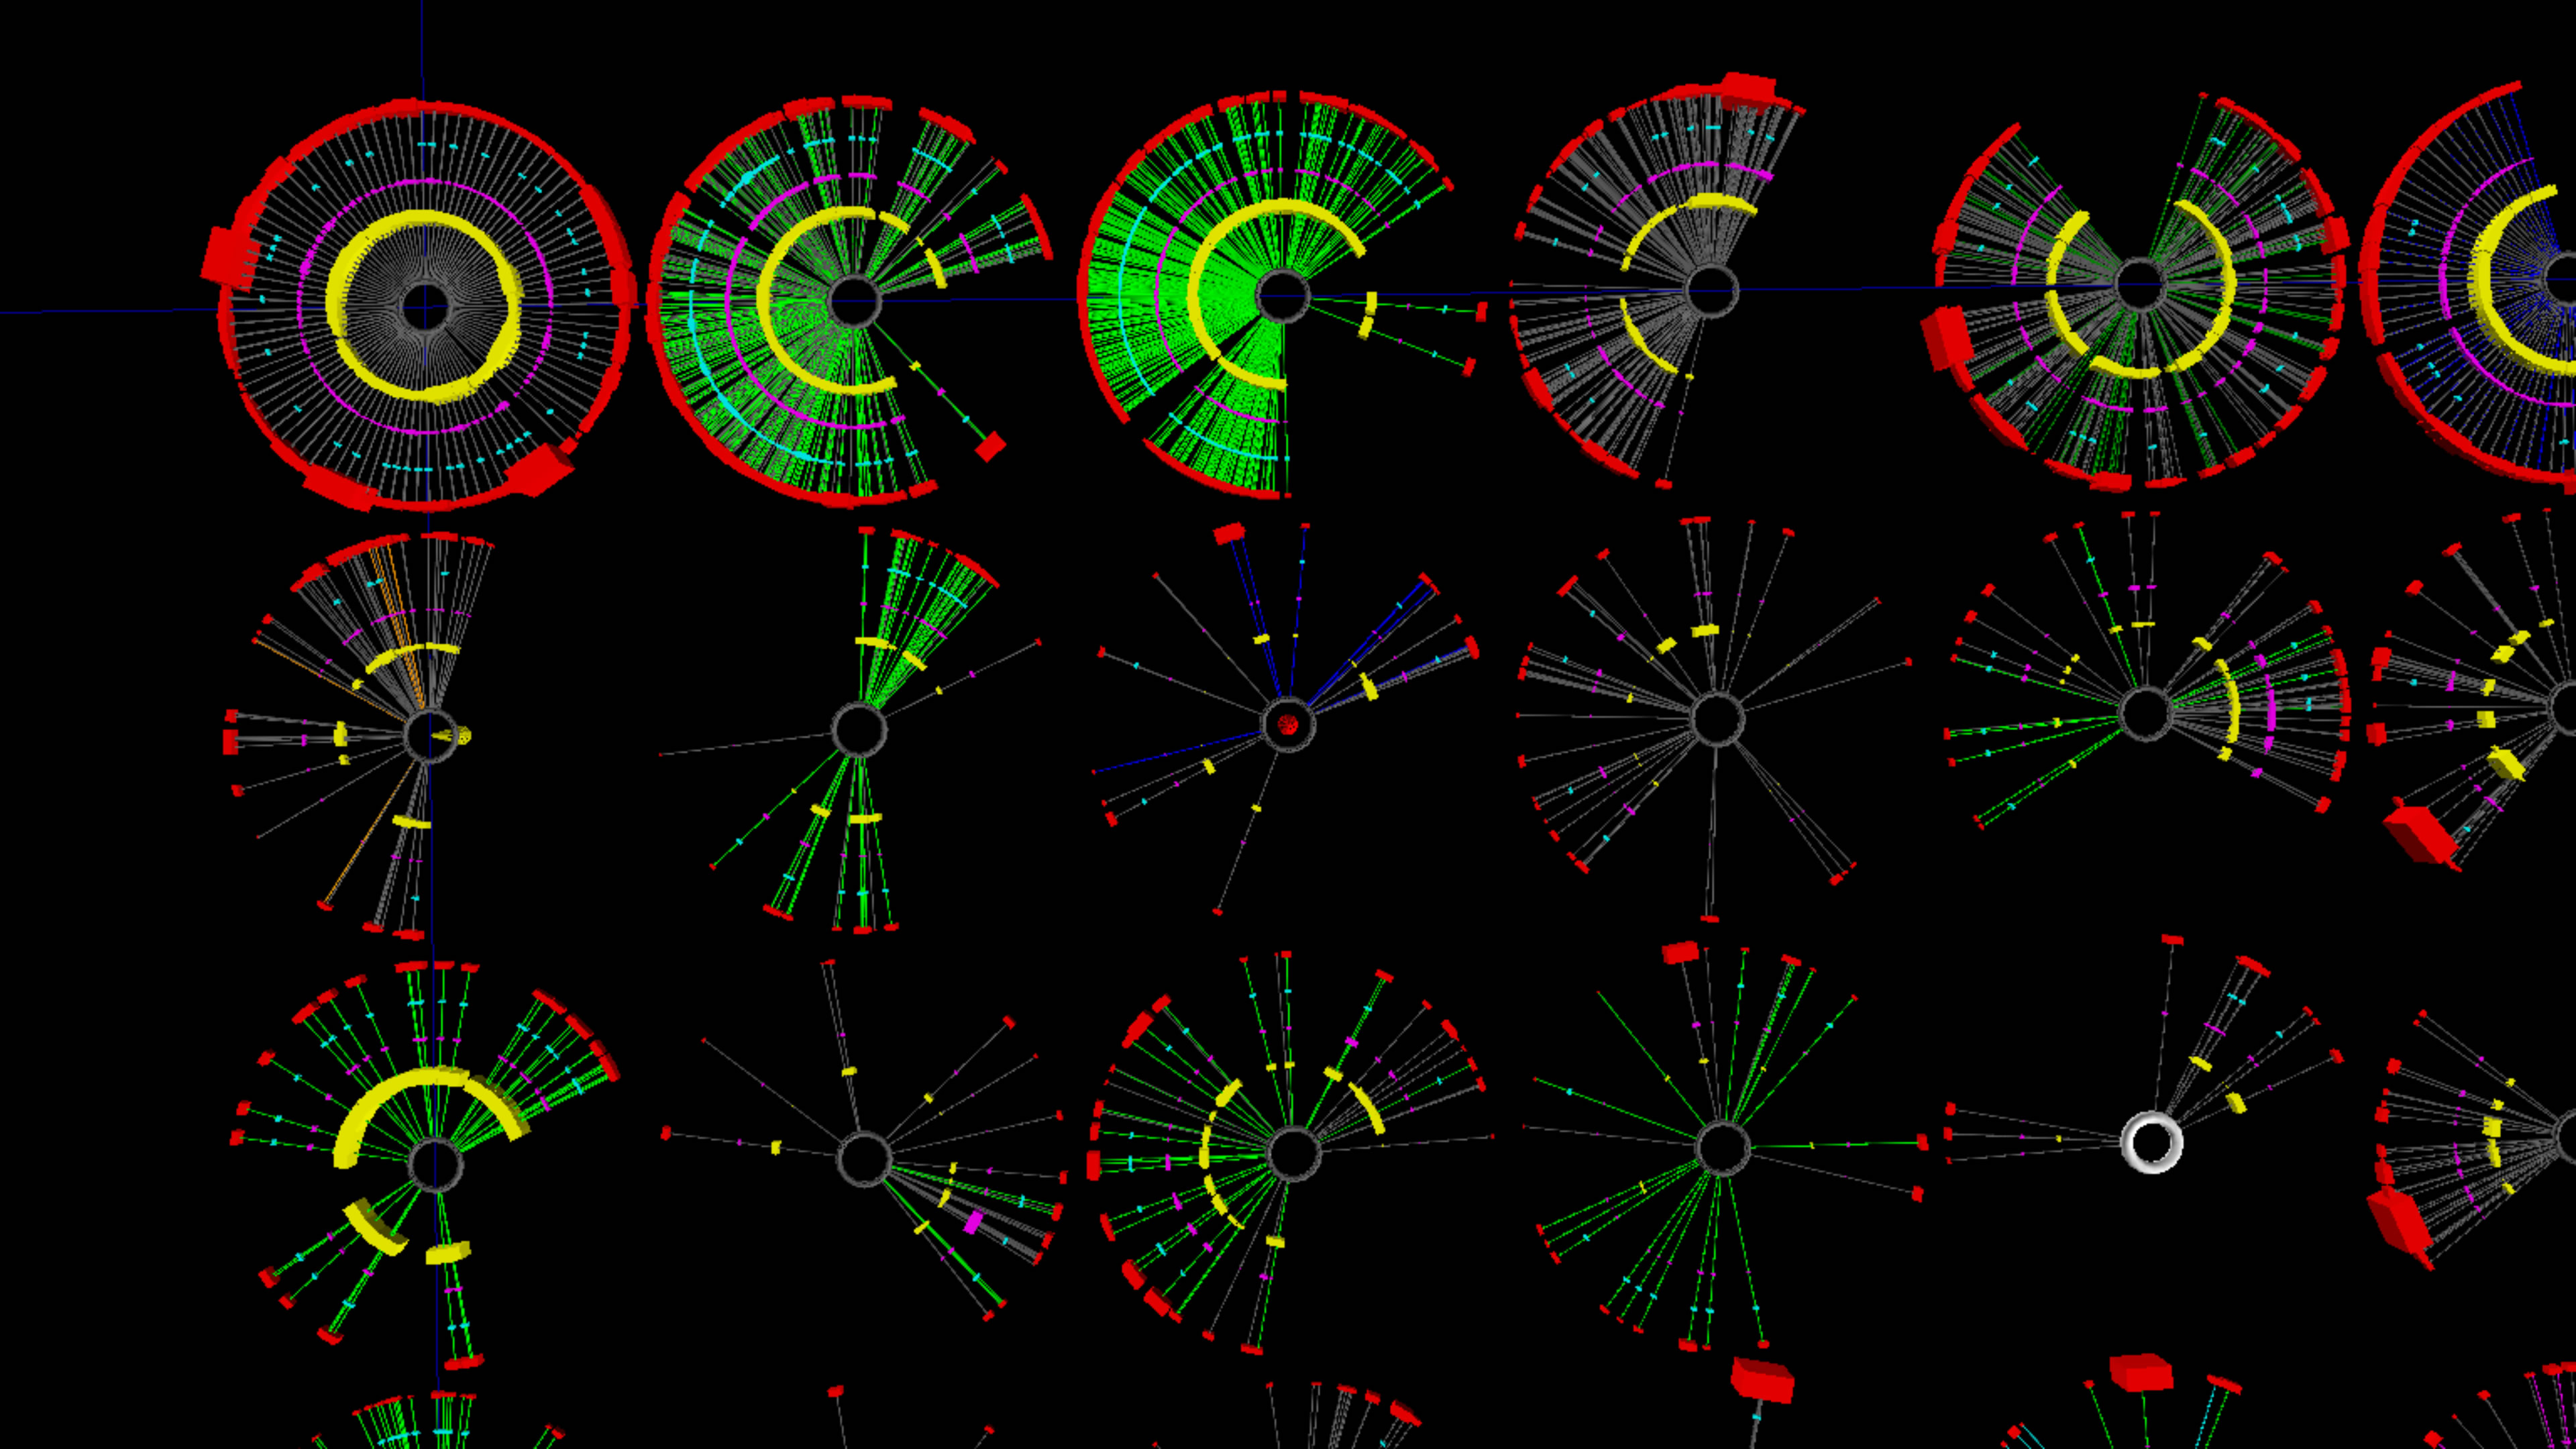
The resulting glyph design is shown below.
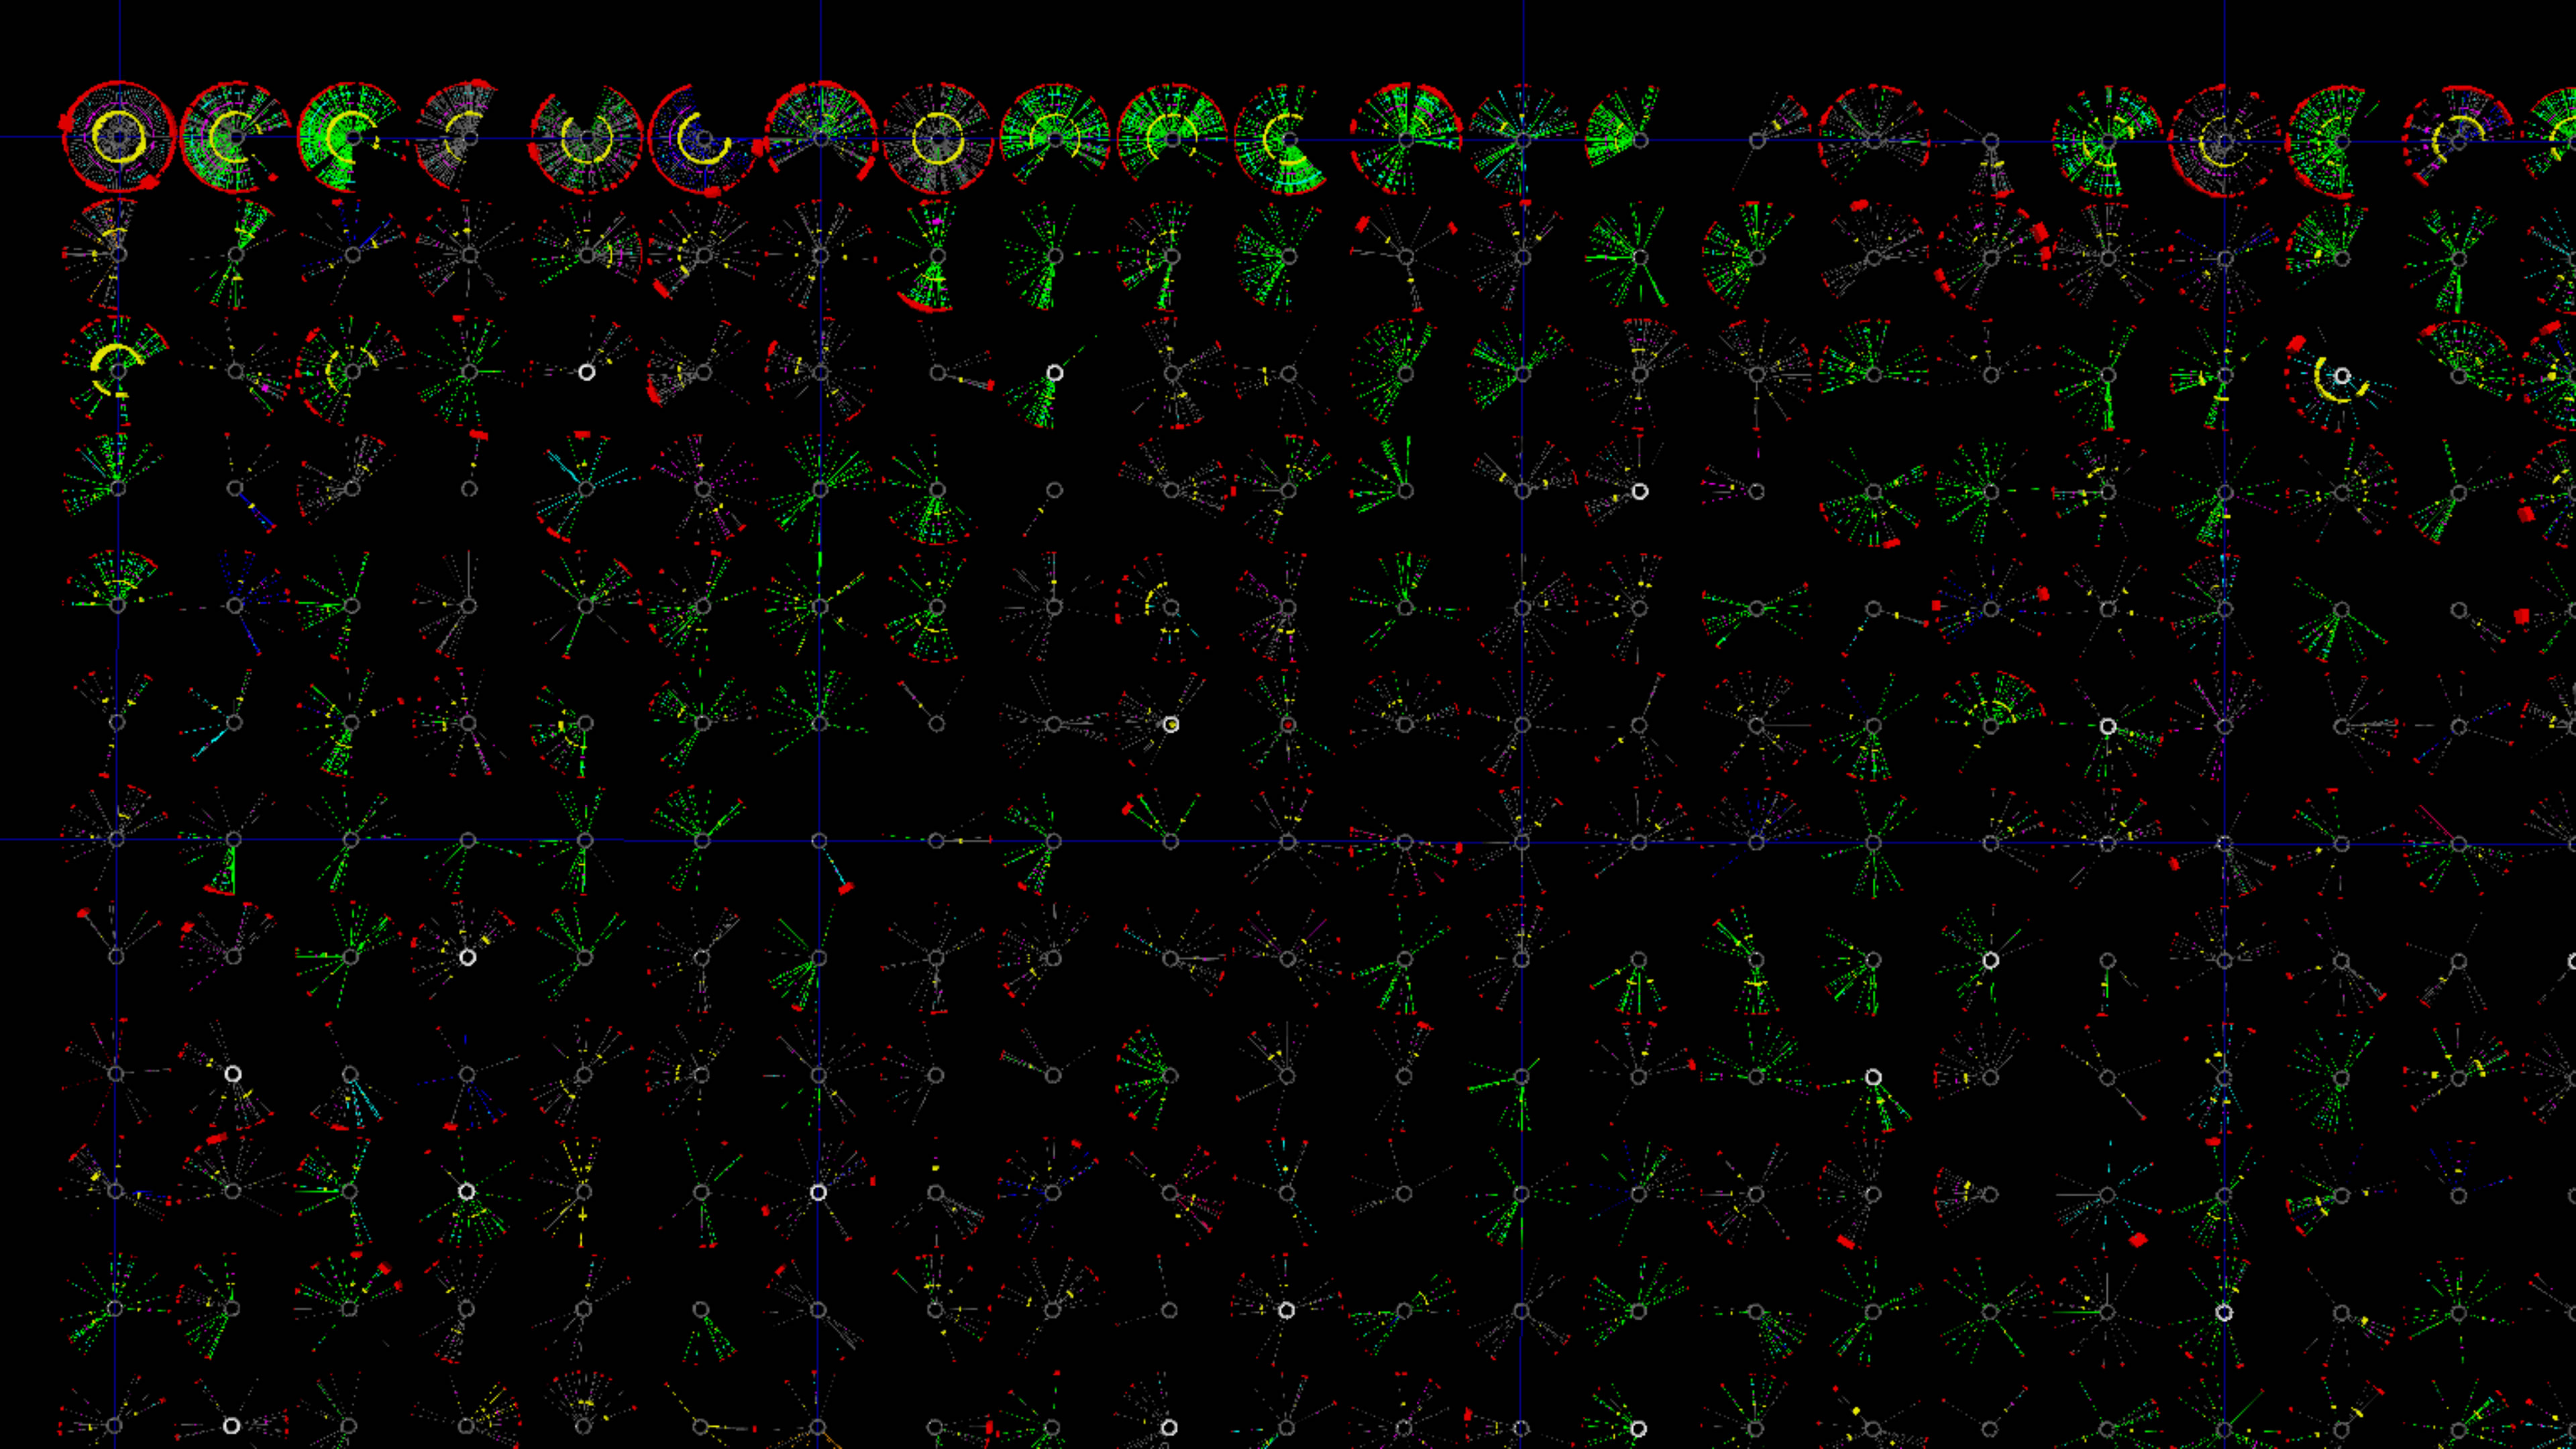
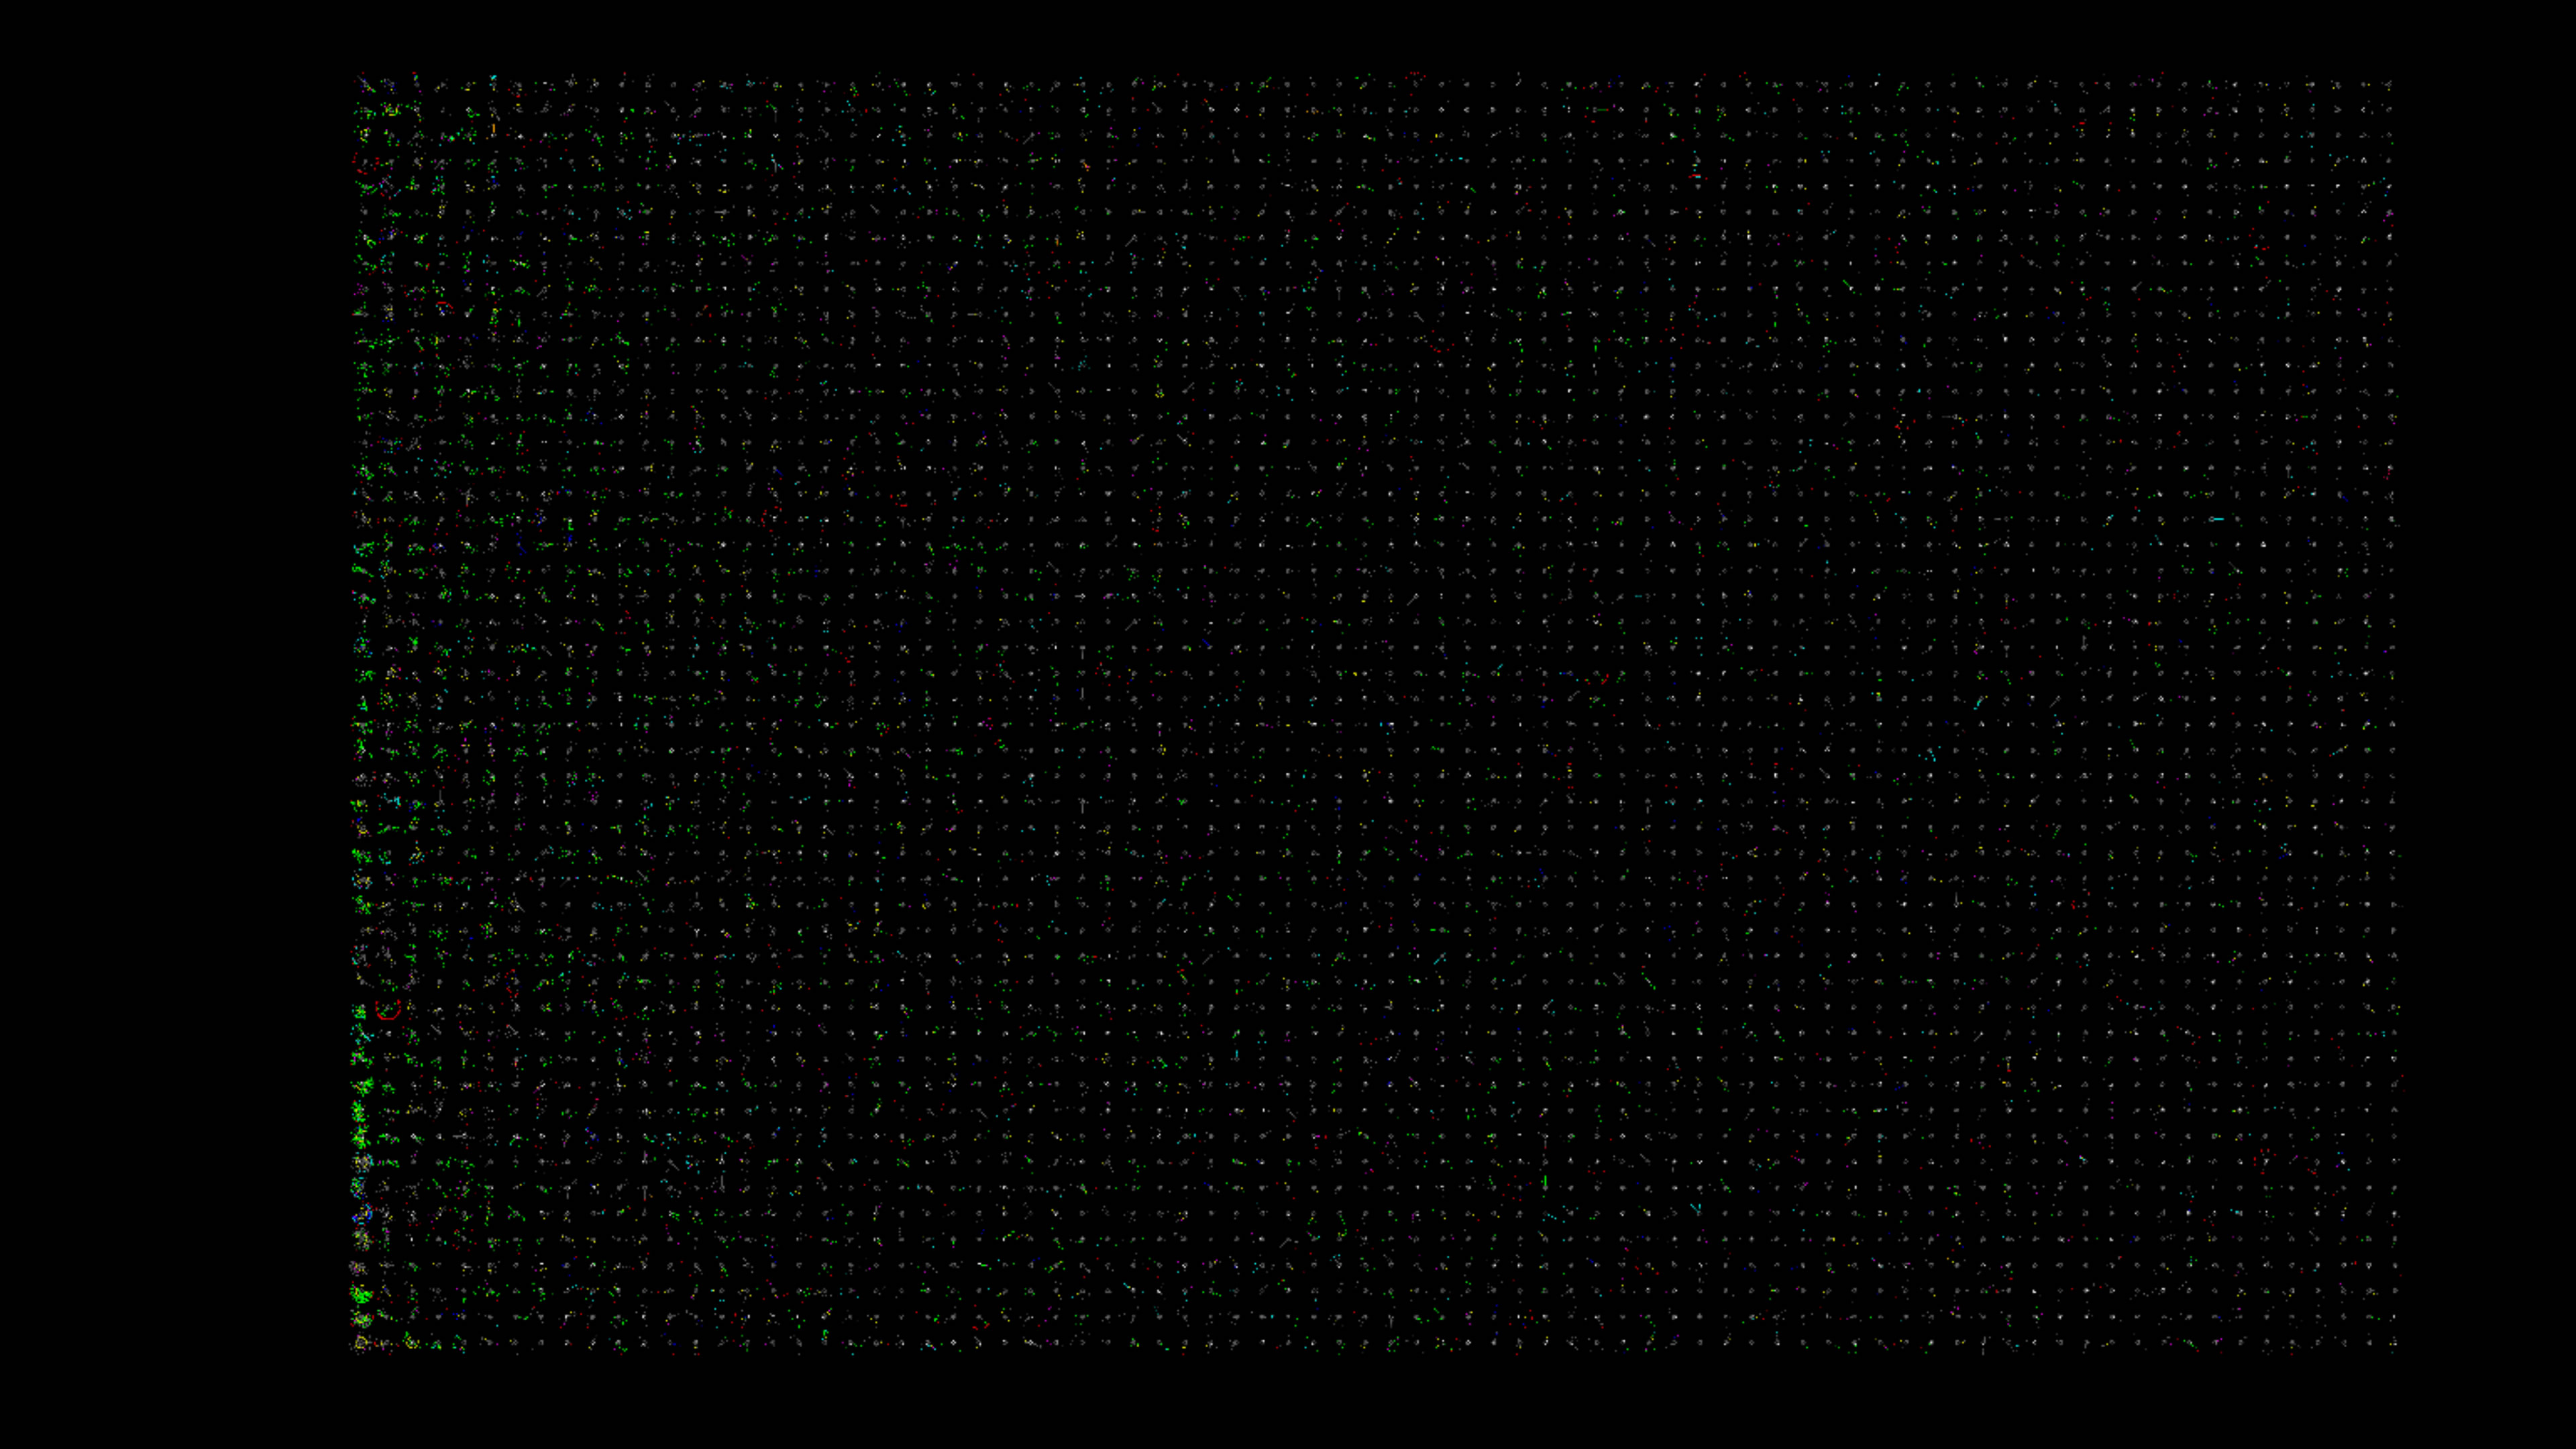
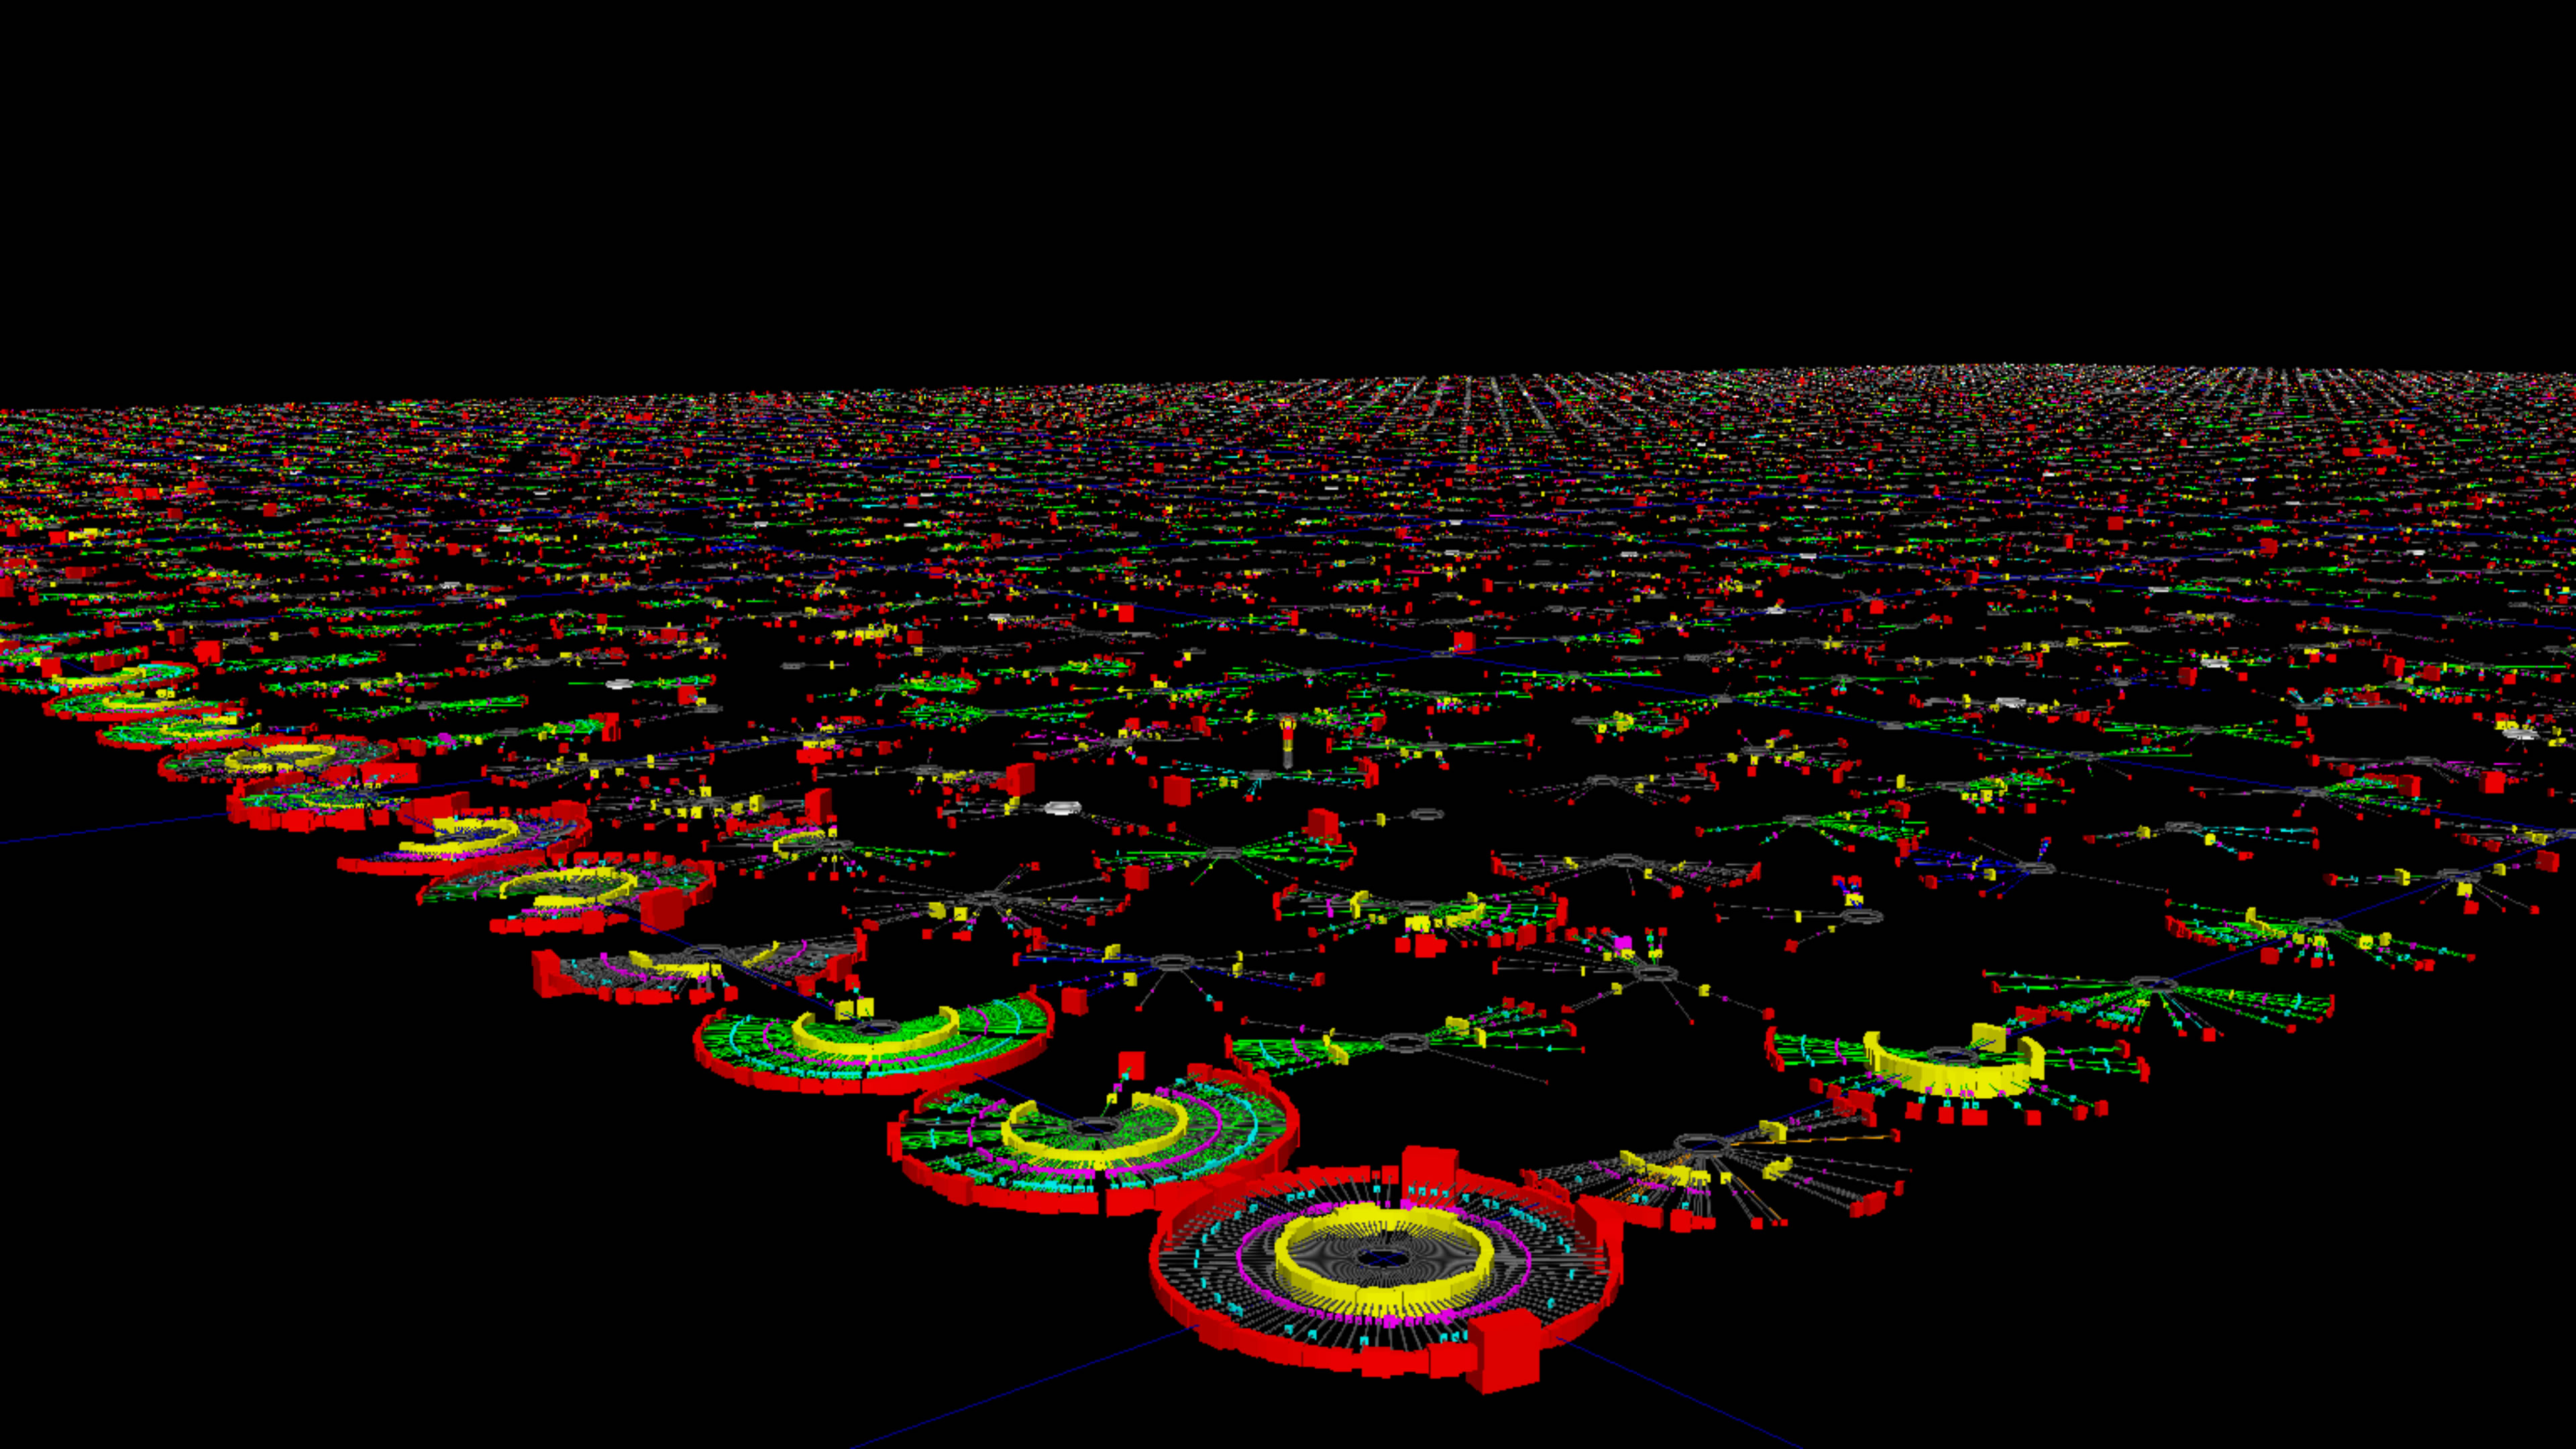
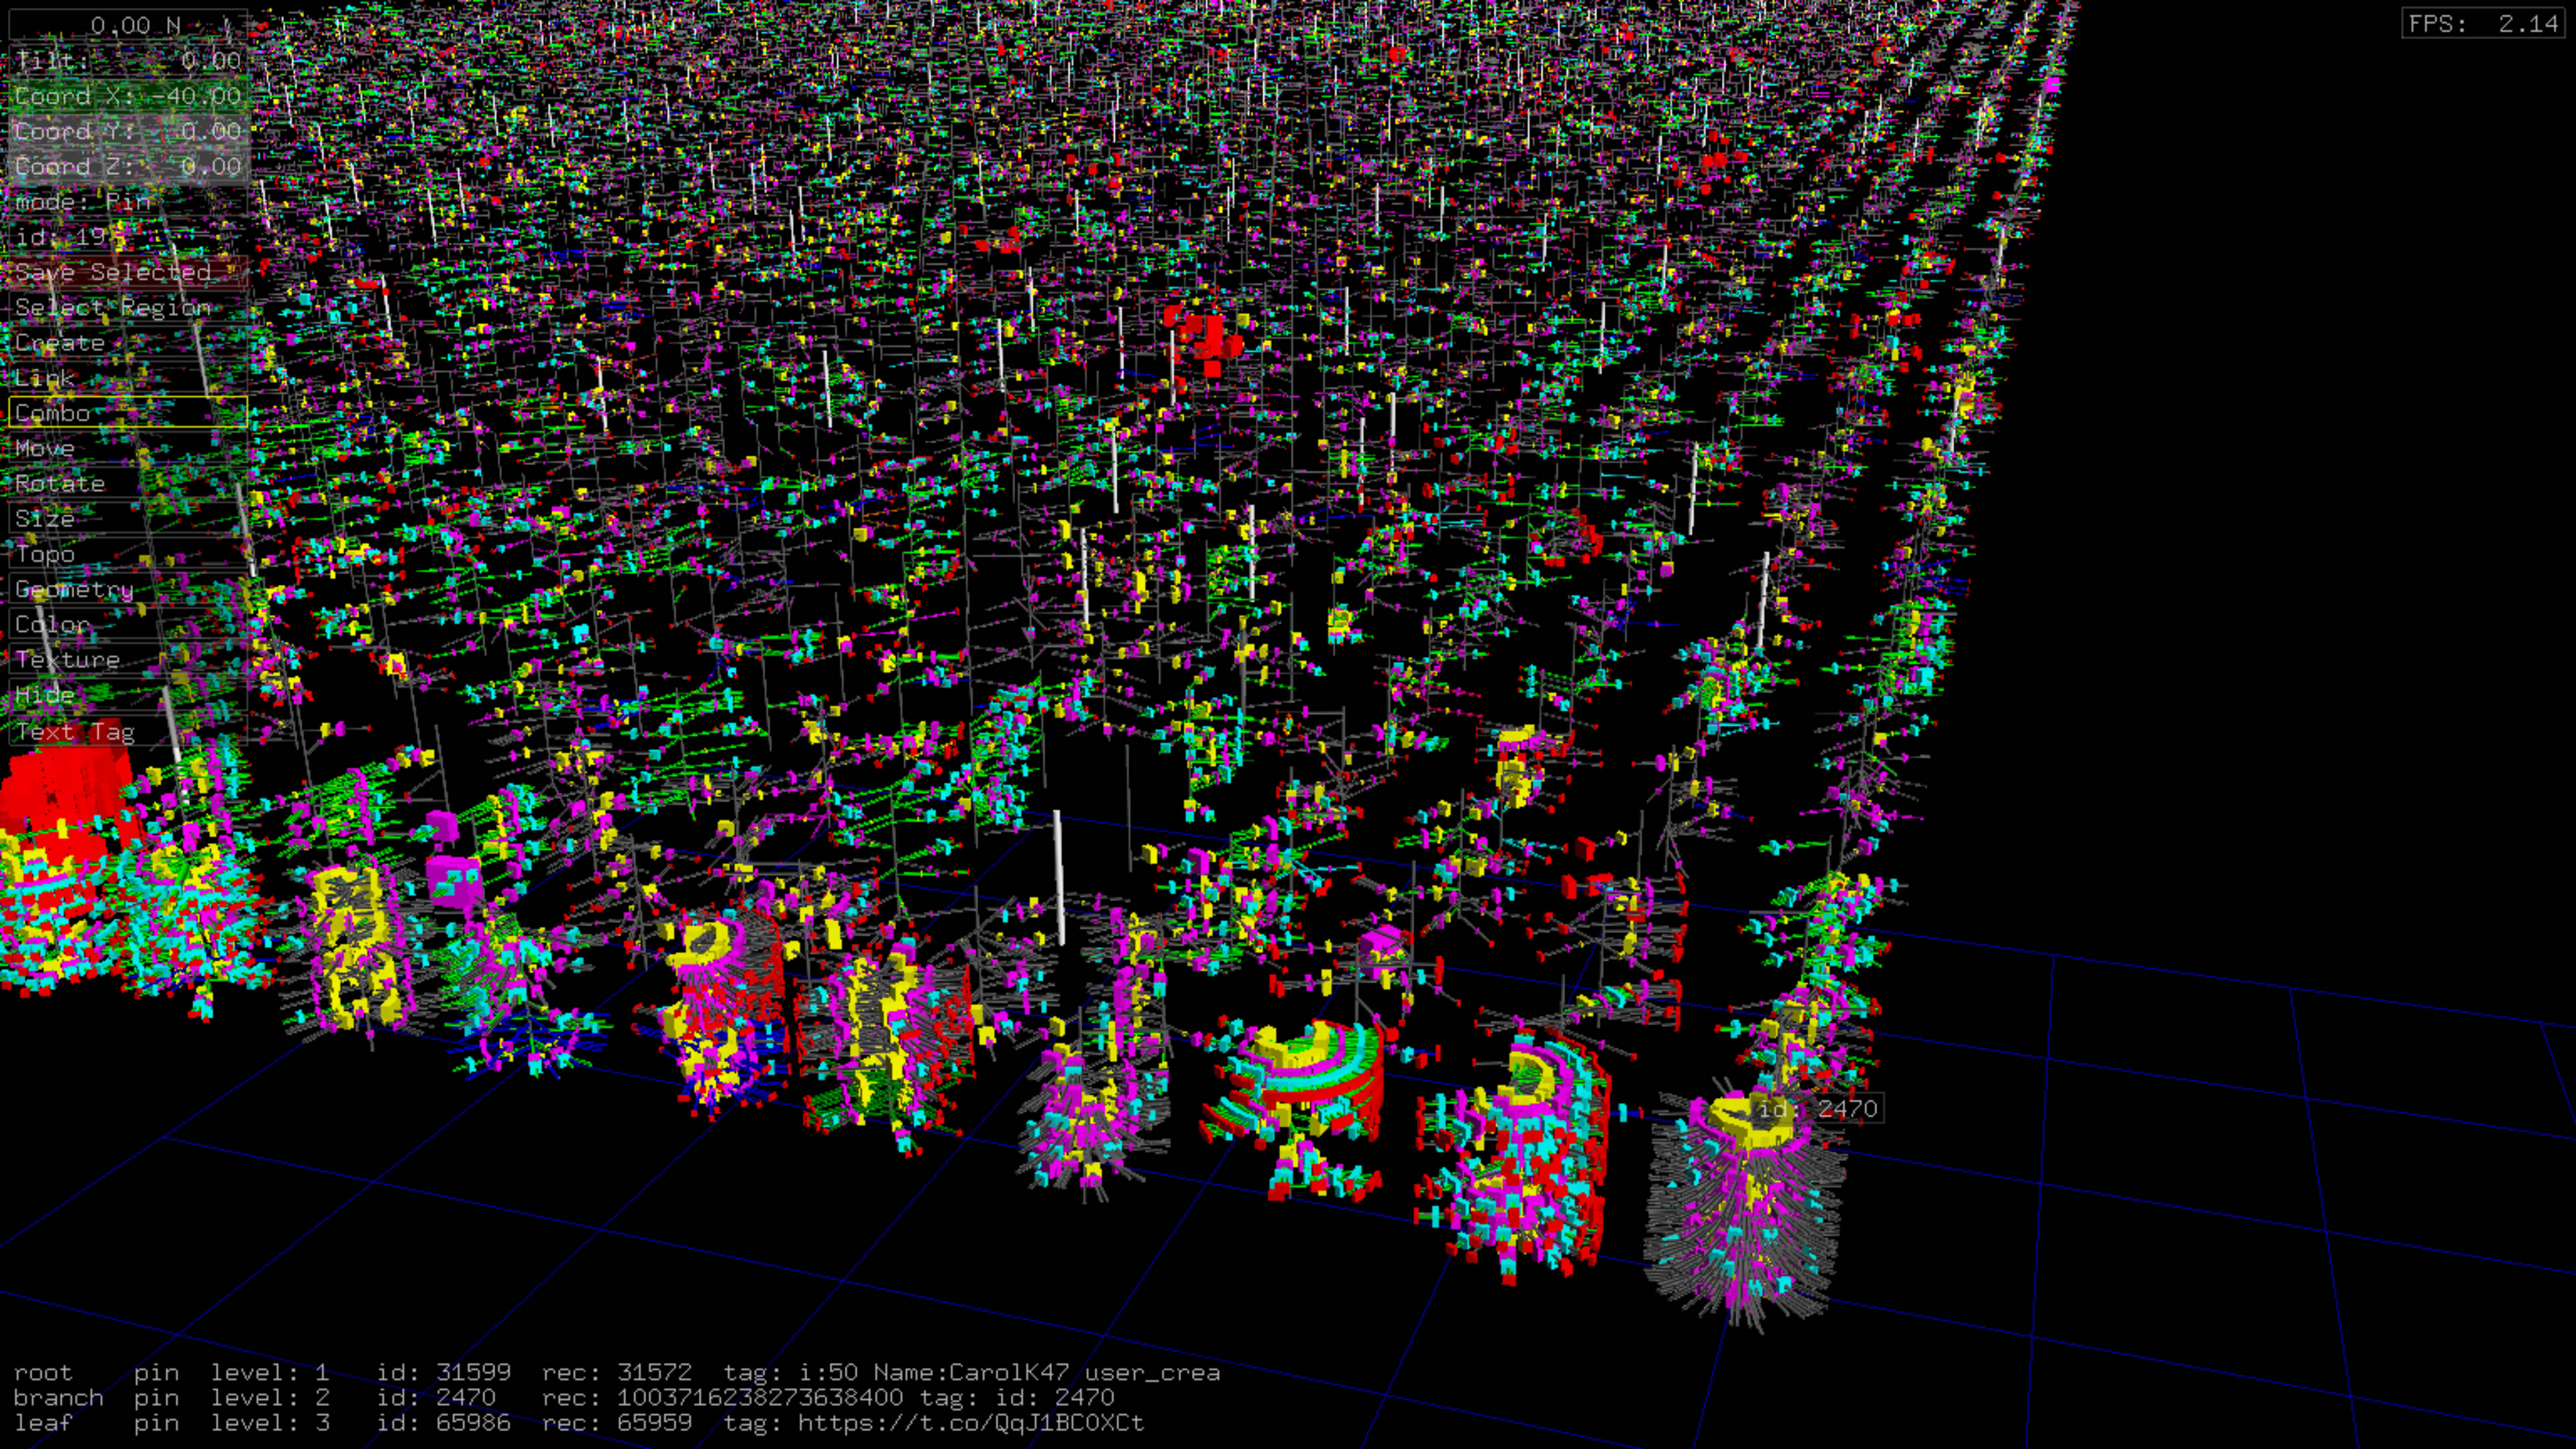
We used this glyph design to visualize the tweet behavior of users who tweeted multiple times in the #trumpcolluded data set. Images below include glyphs for the top 4000 retweeters sorted from left to right and top to bottom.
With Temporal Axis Modification, Top 1000 Tweeters
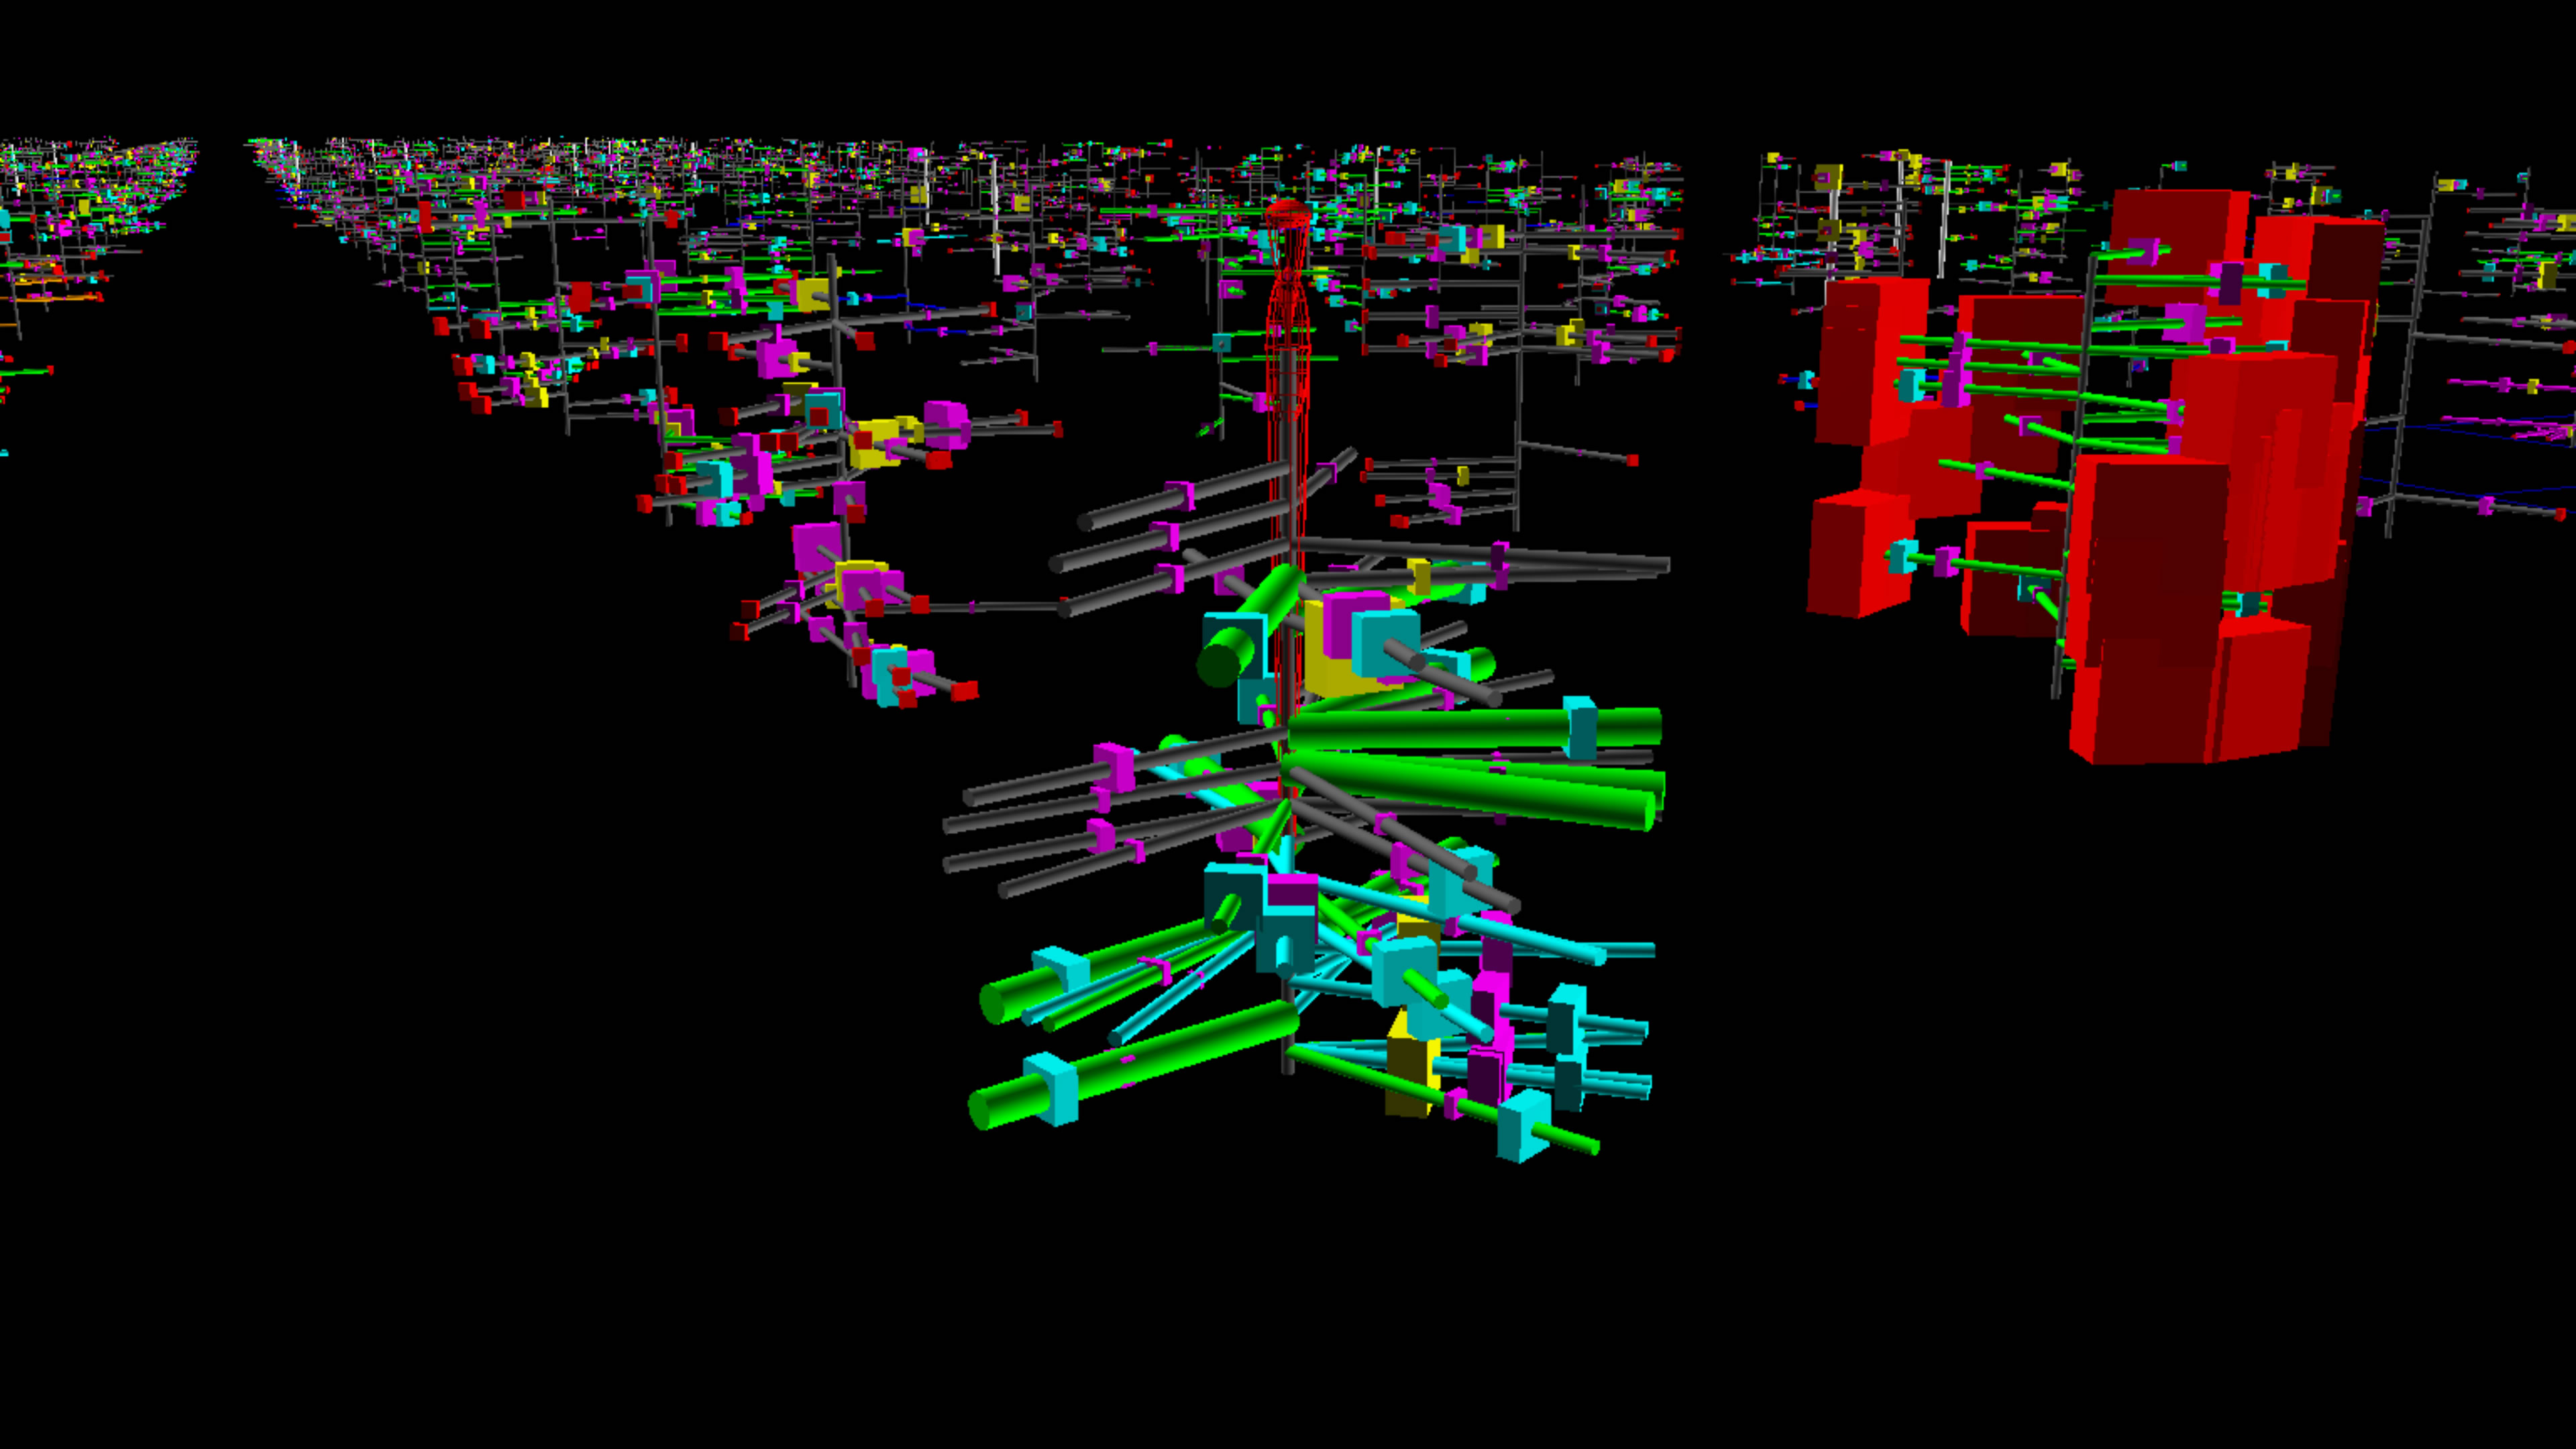
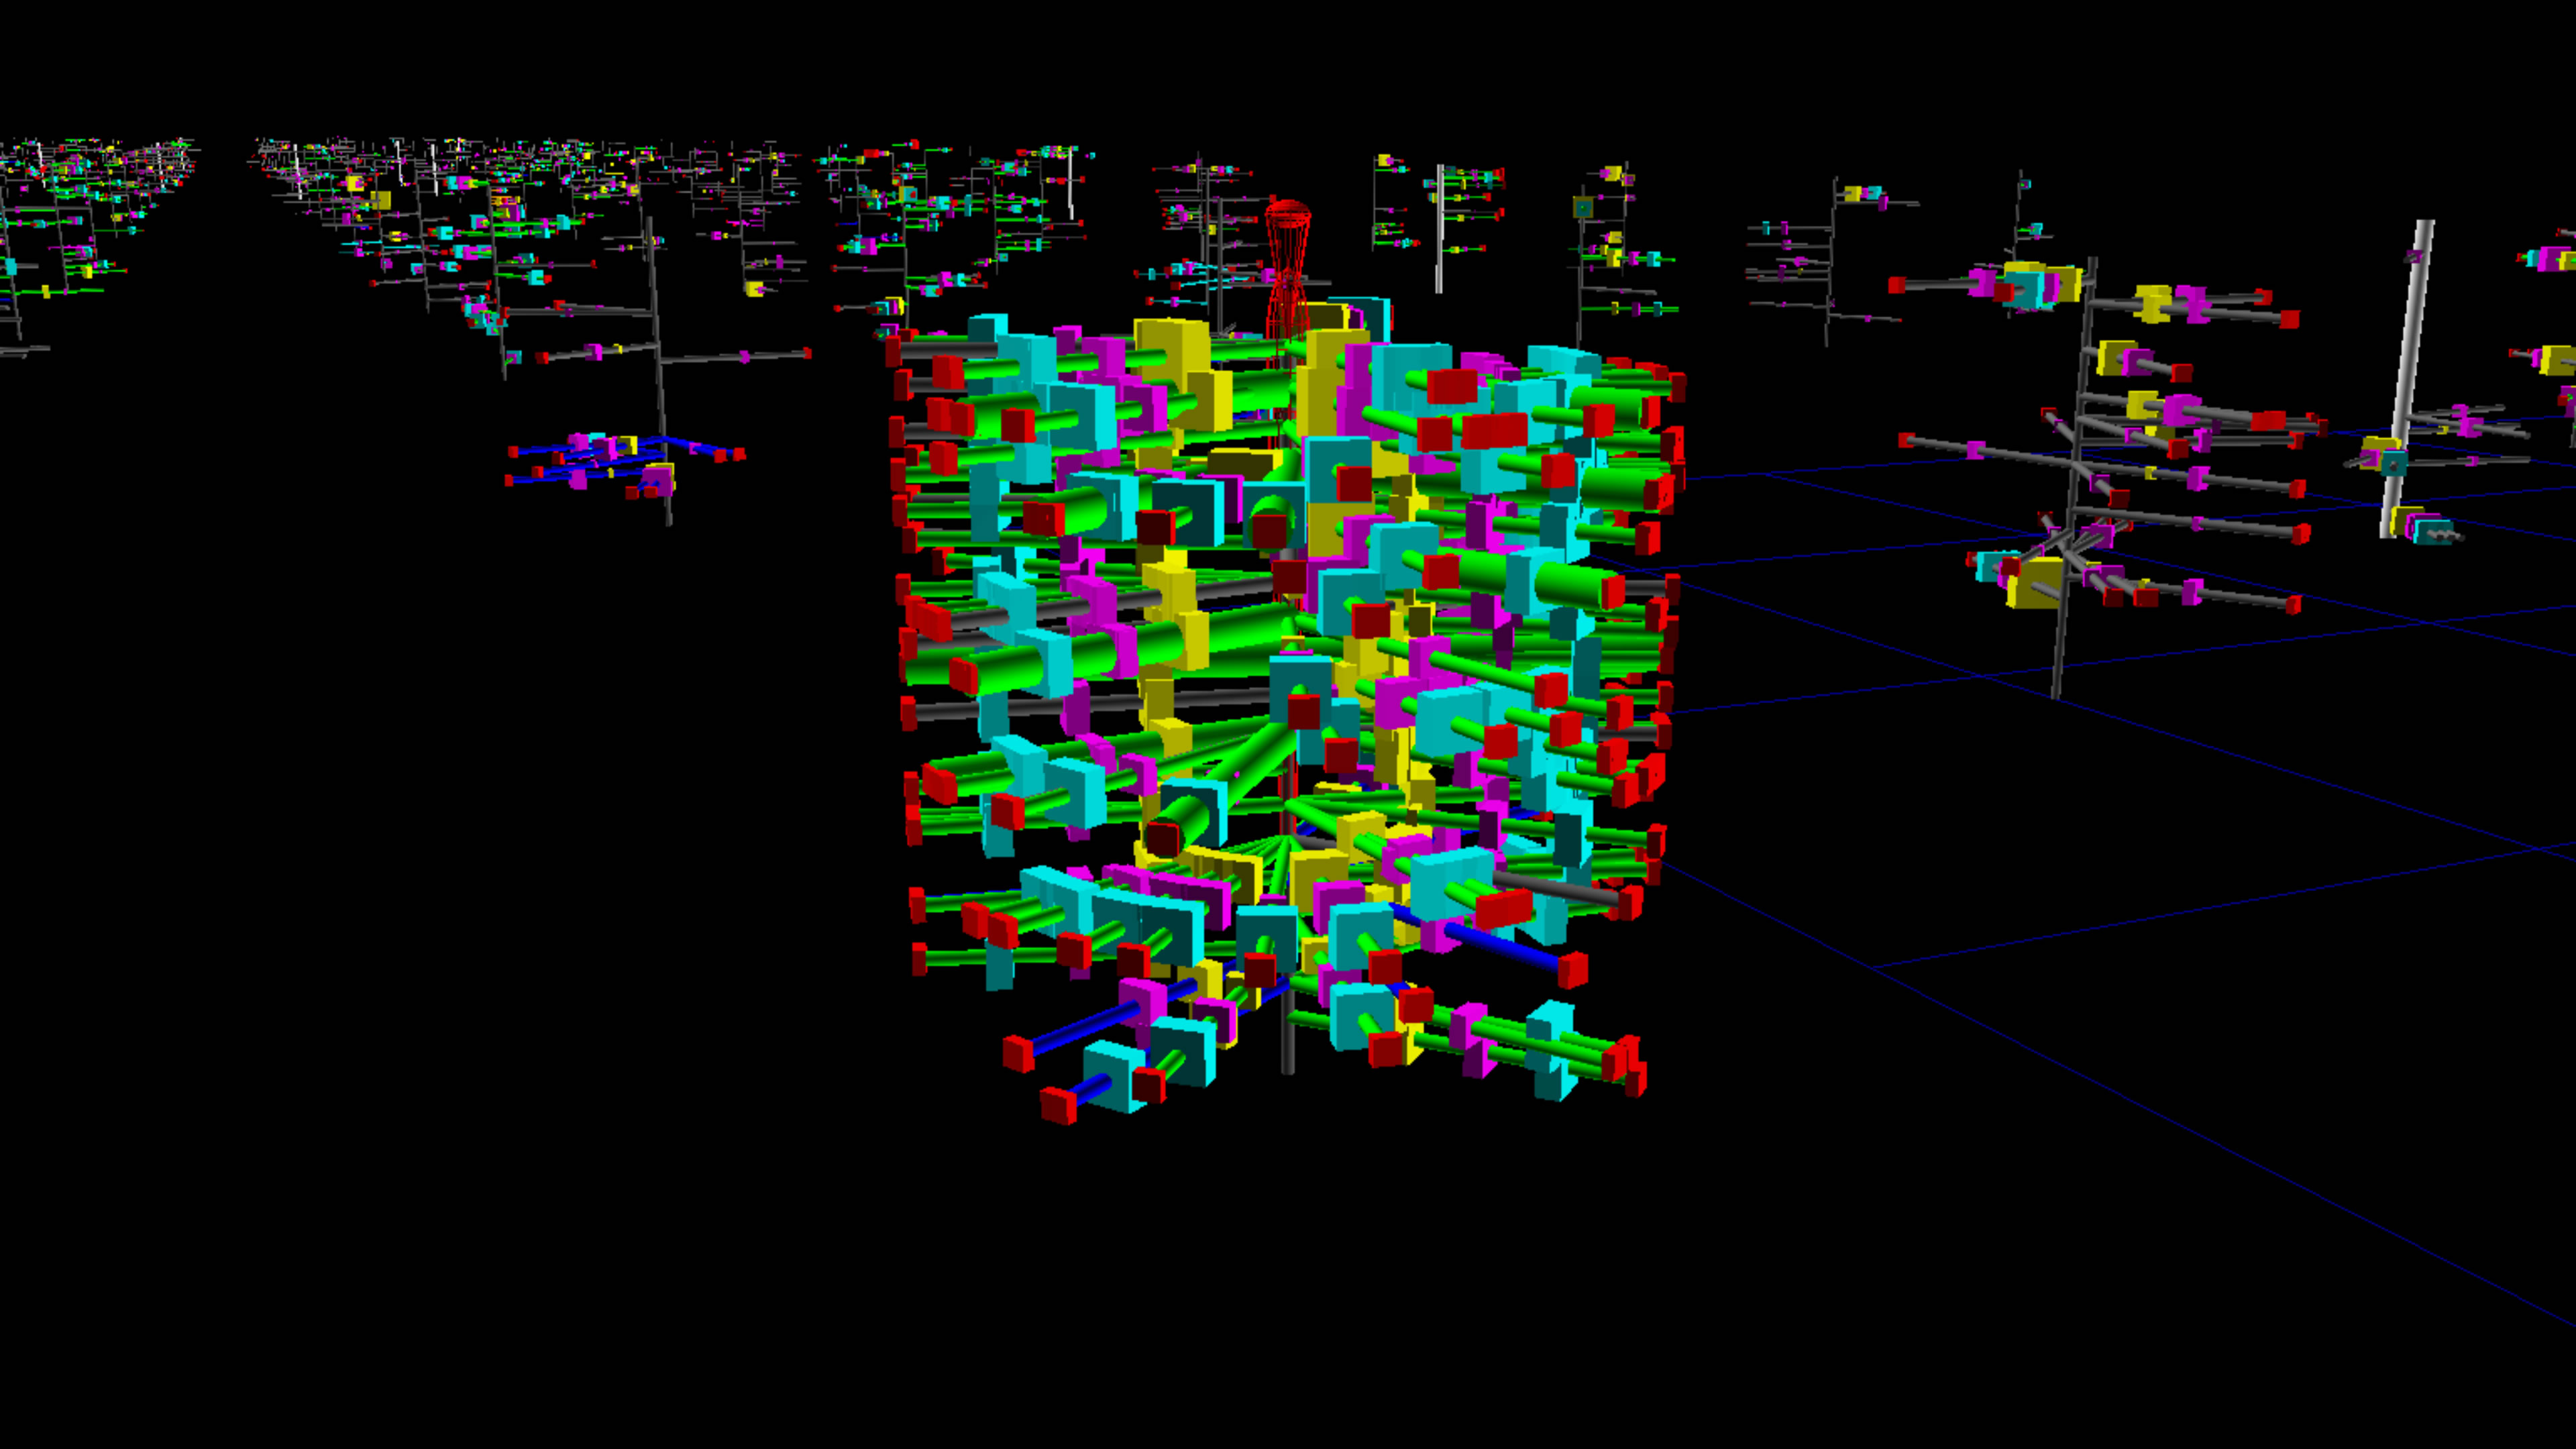
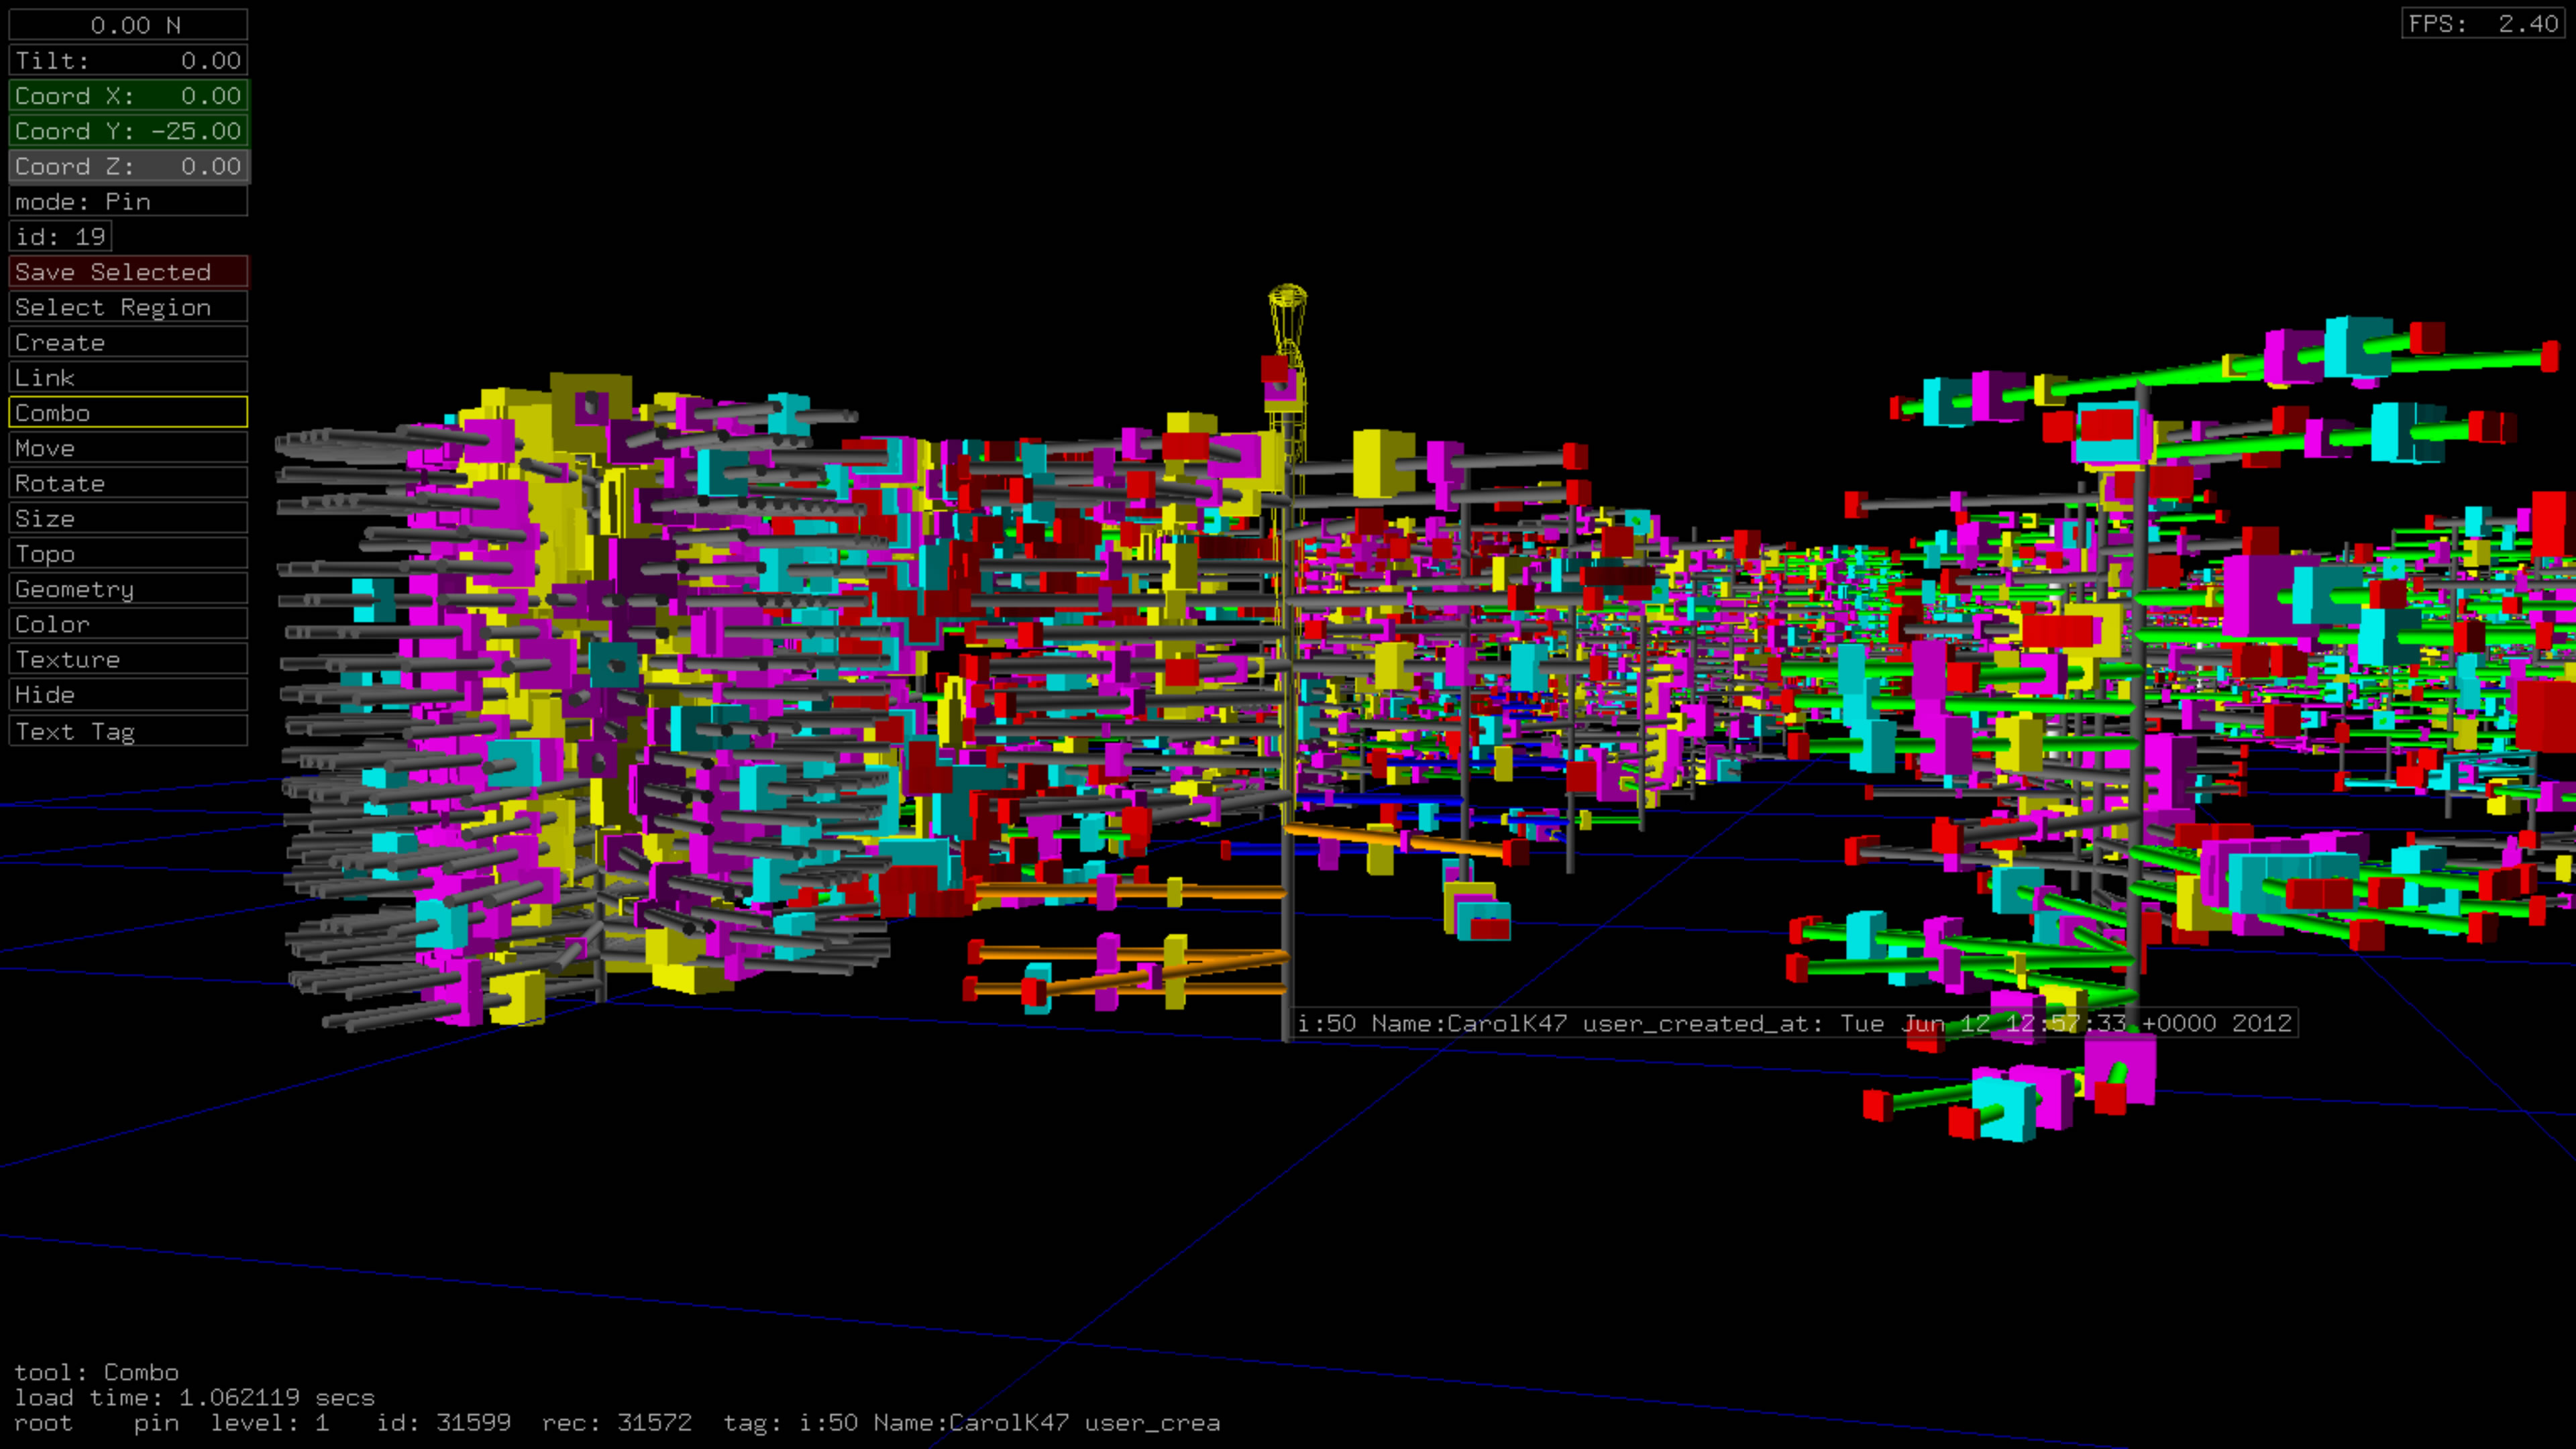
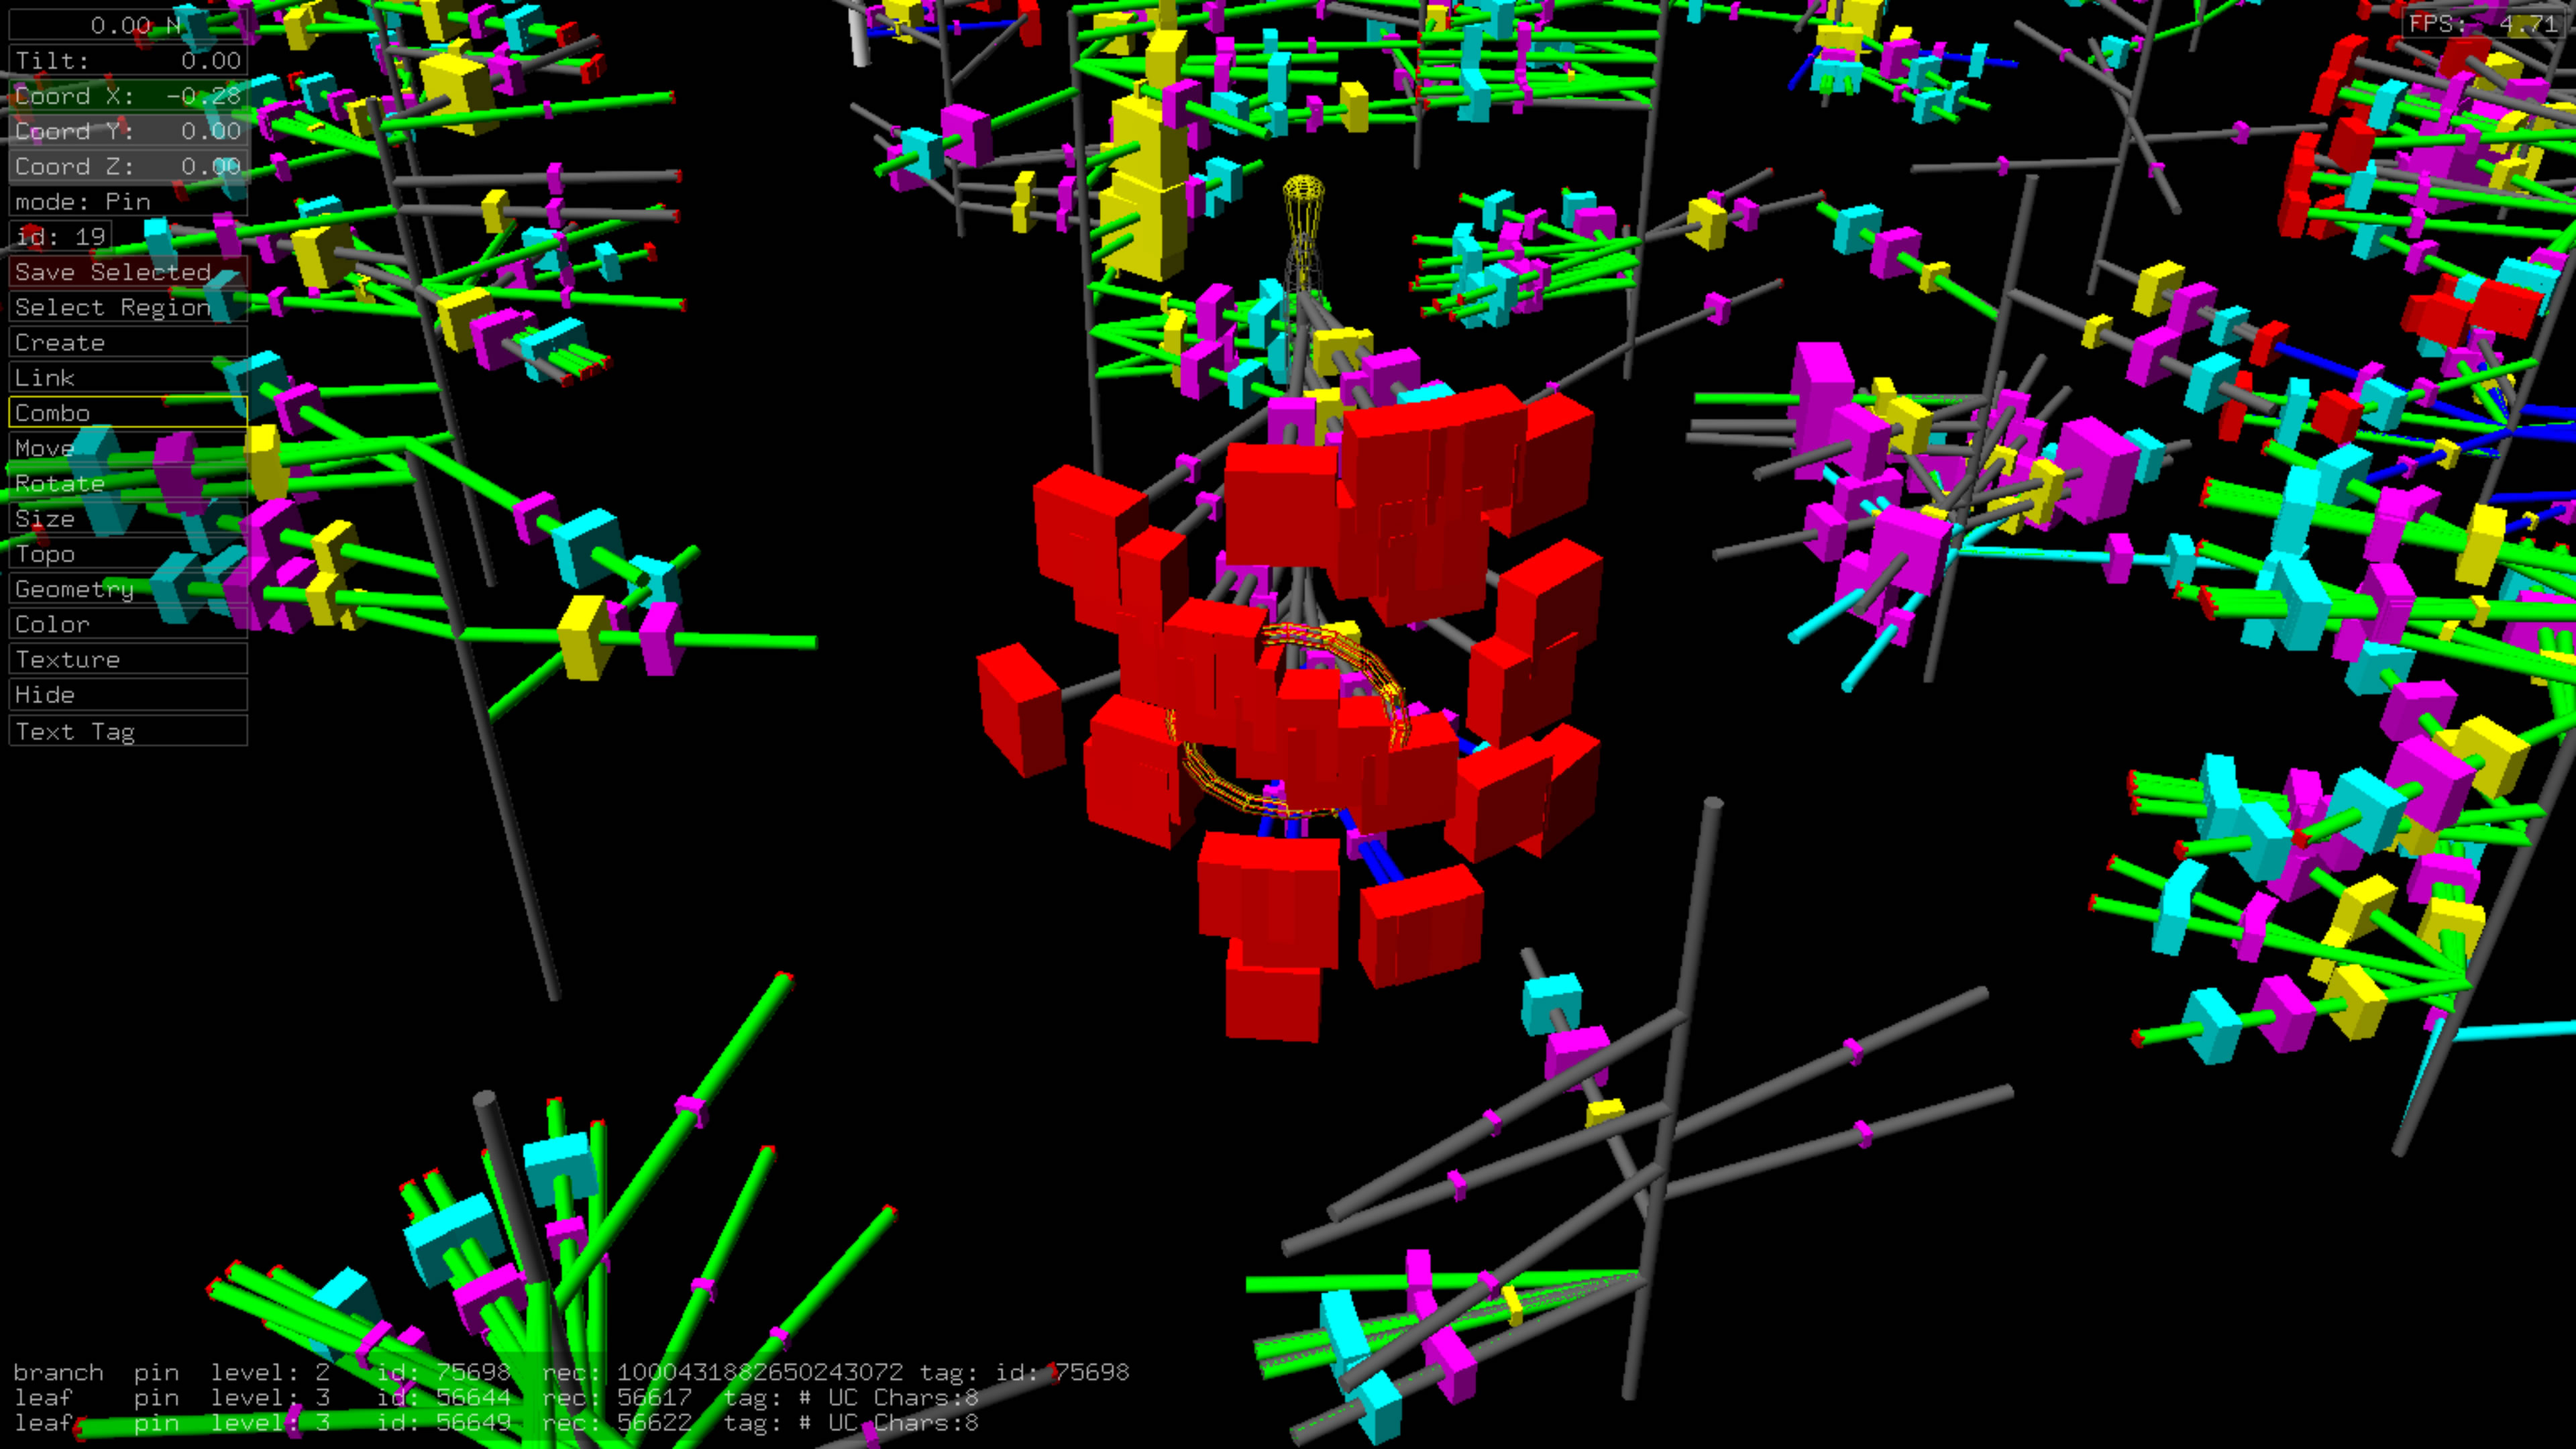
The original glyph design collapsed all days into a single level, to get a better sense of overall tweet behavior. Further modification expanded the temporal (vertical) axis to reveal individual daily tweet behavior as shown in the images below. Thus, a layered appearance shows individual days corresponding to individual layers.
Download ANTz Visualization for Windows
Time vs. Top Tweeters
Download ANTz visualization of time vs. top tweeters for Windows.
Download iPython Notebook to create ANTz visualization.
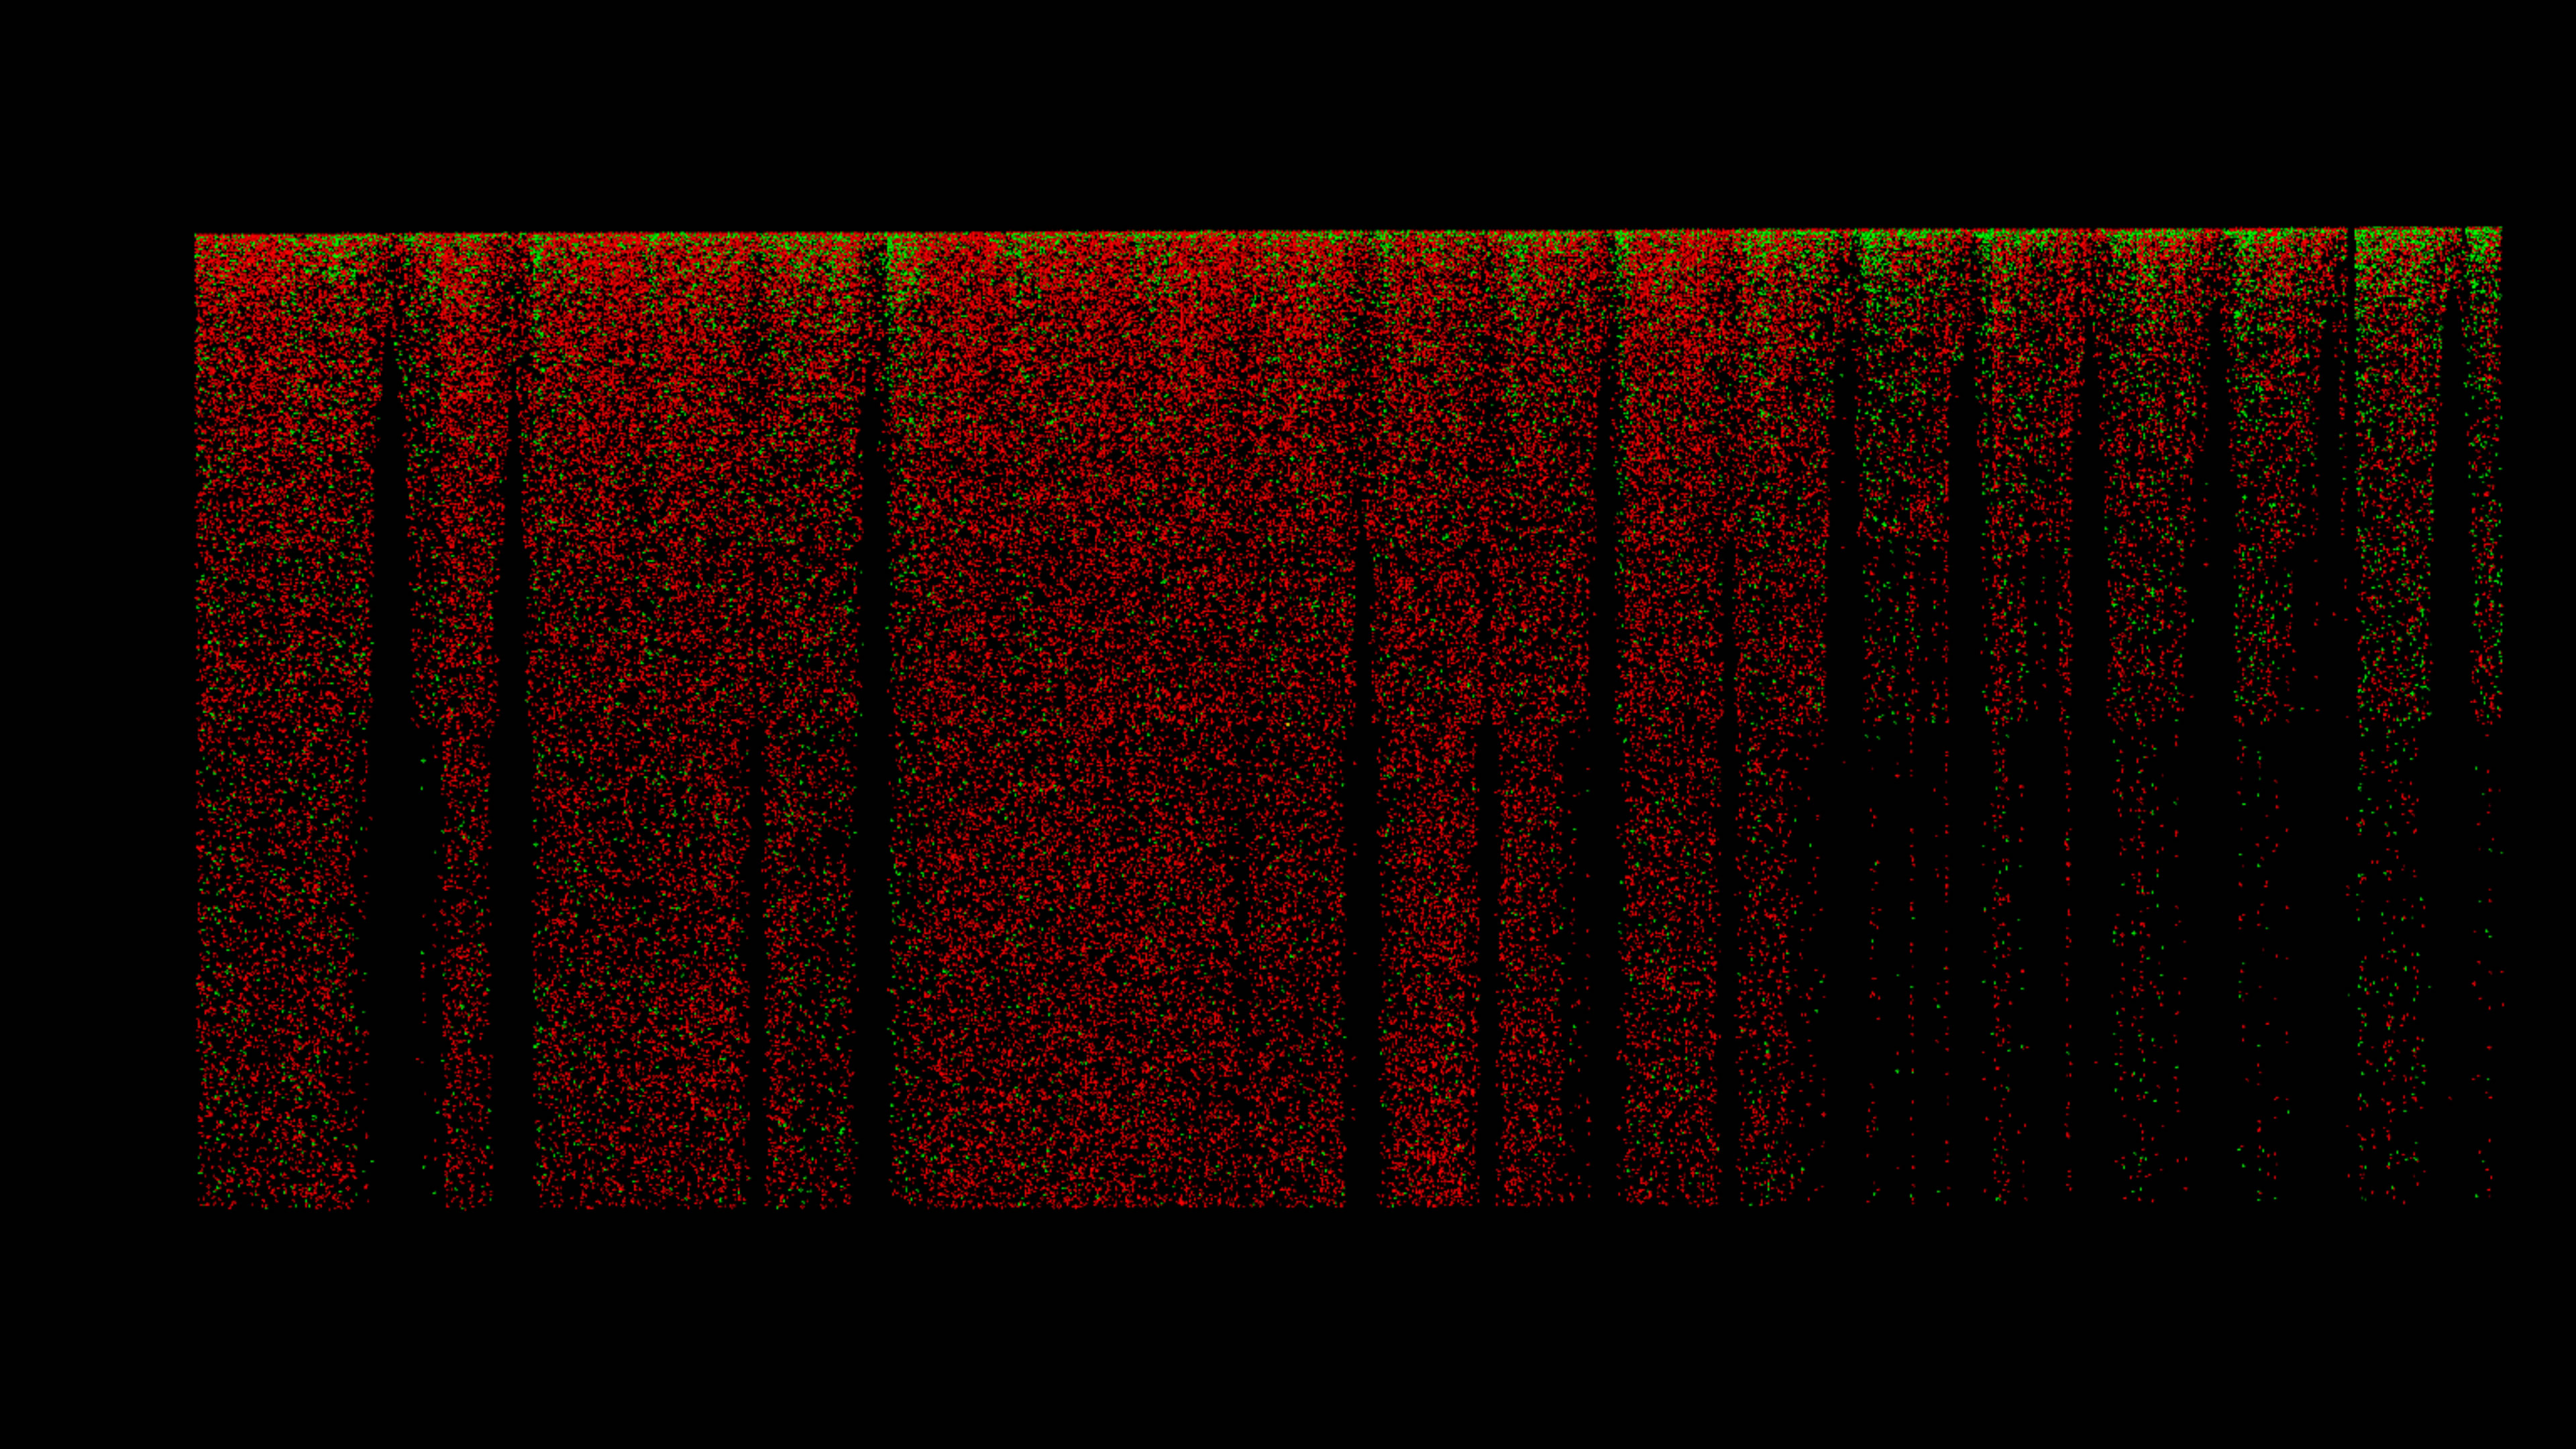
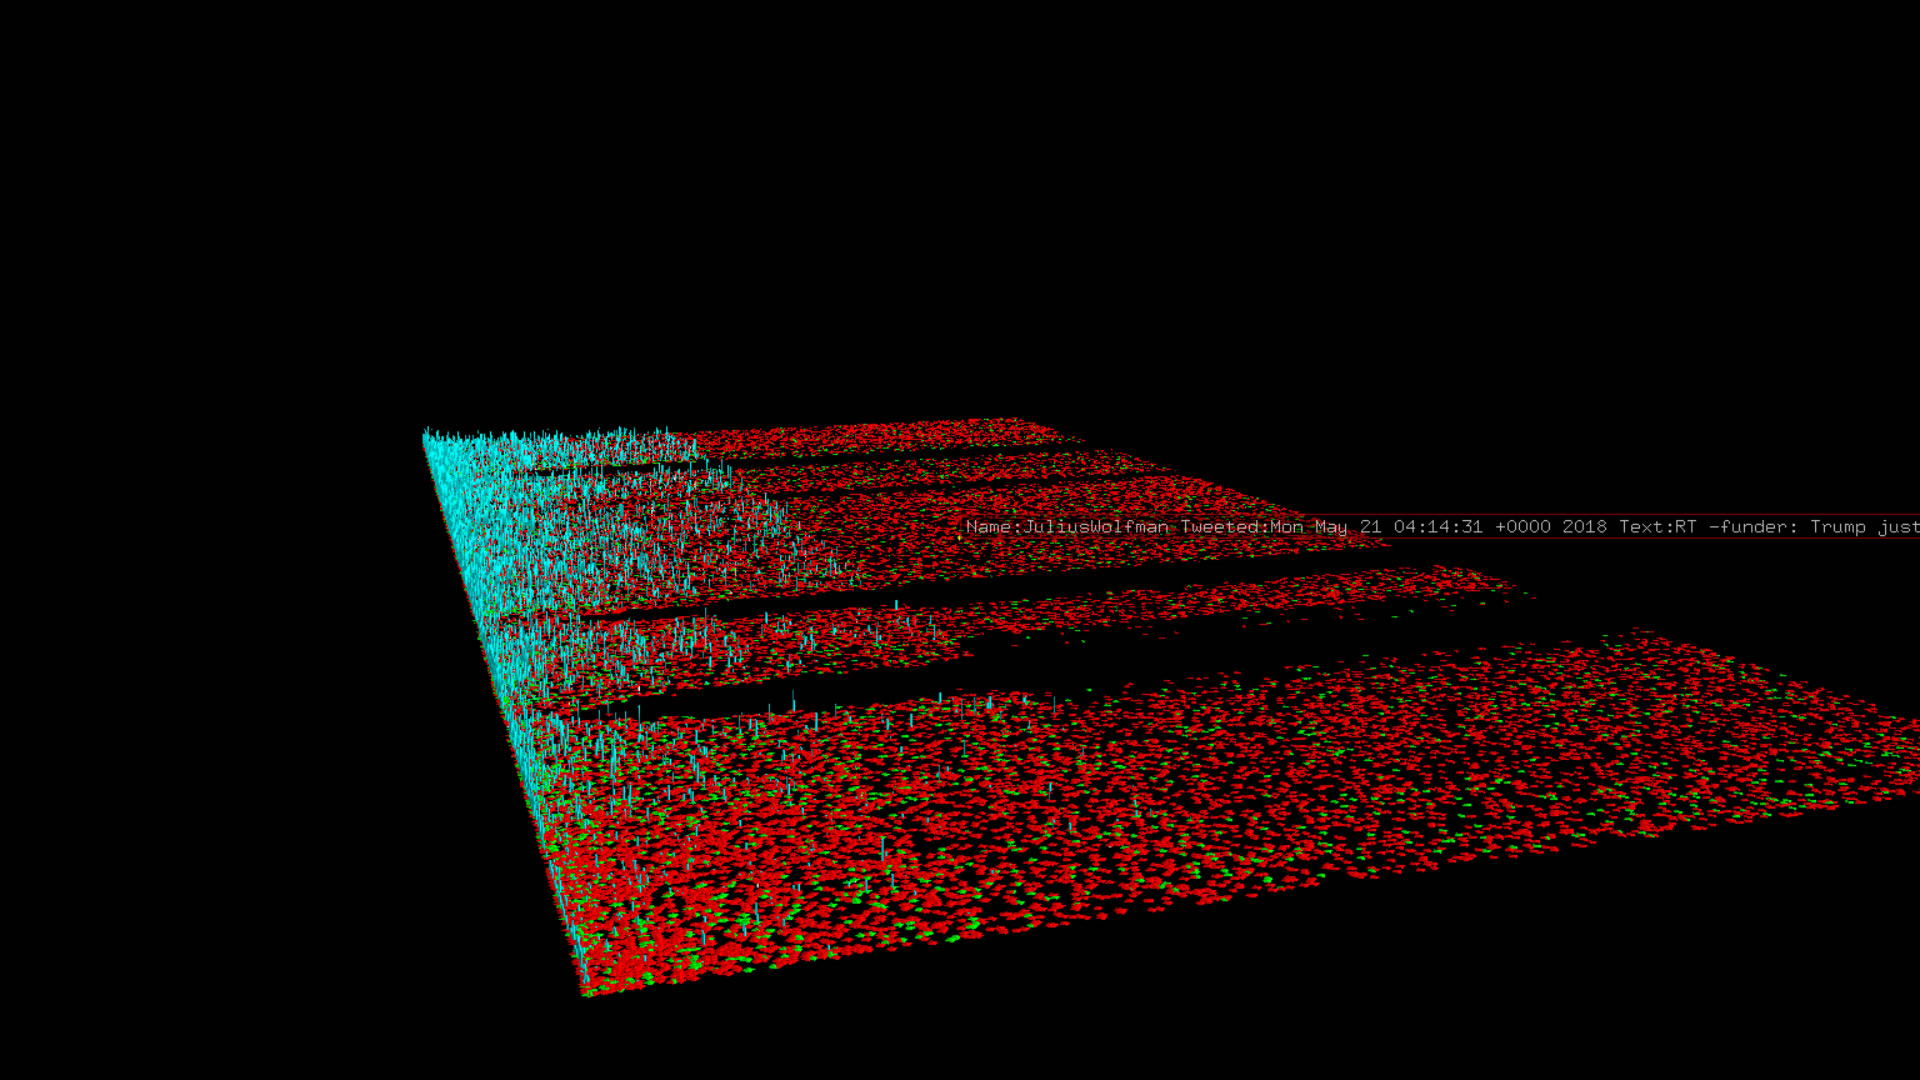
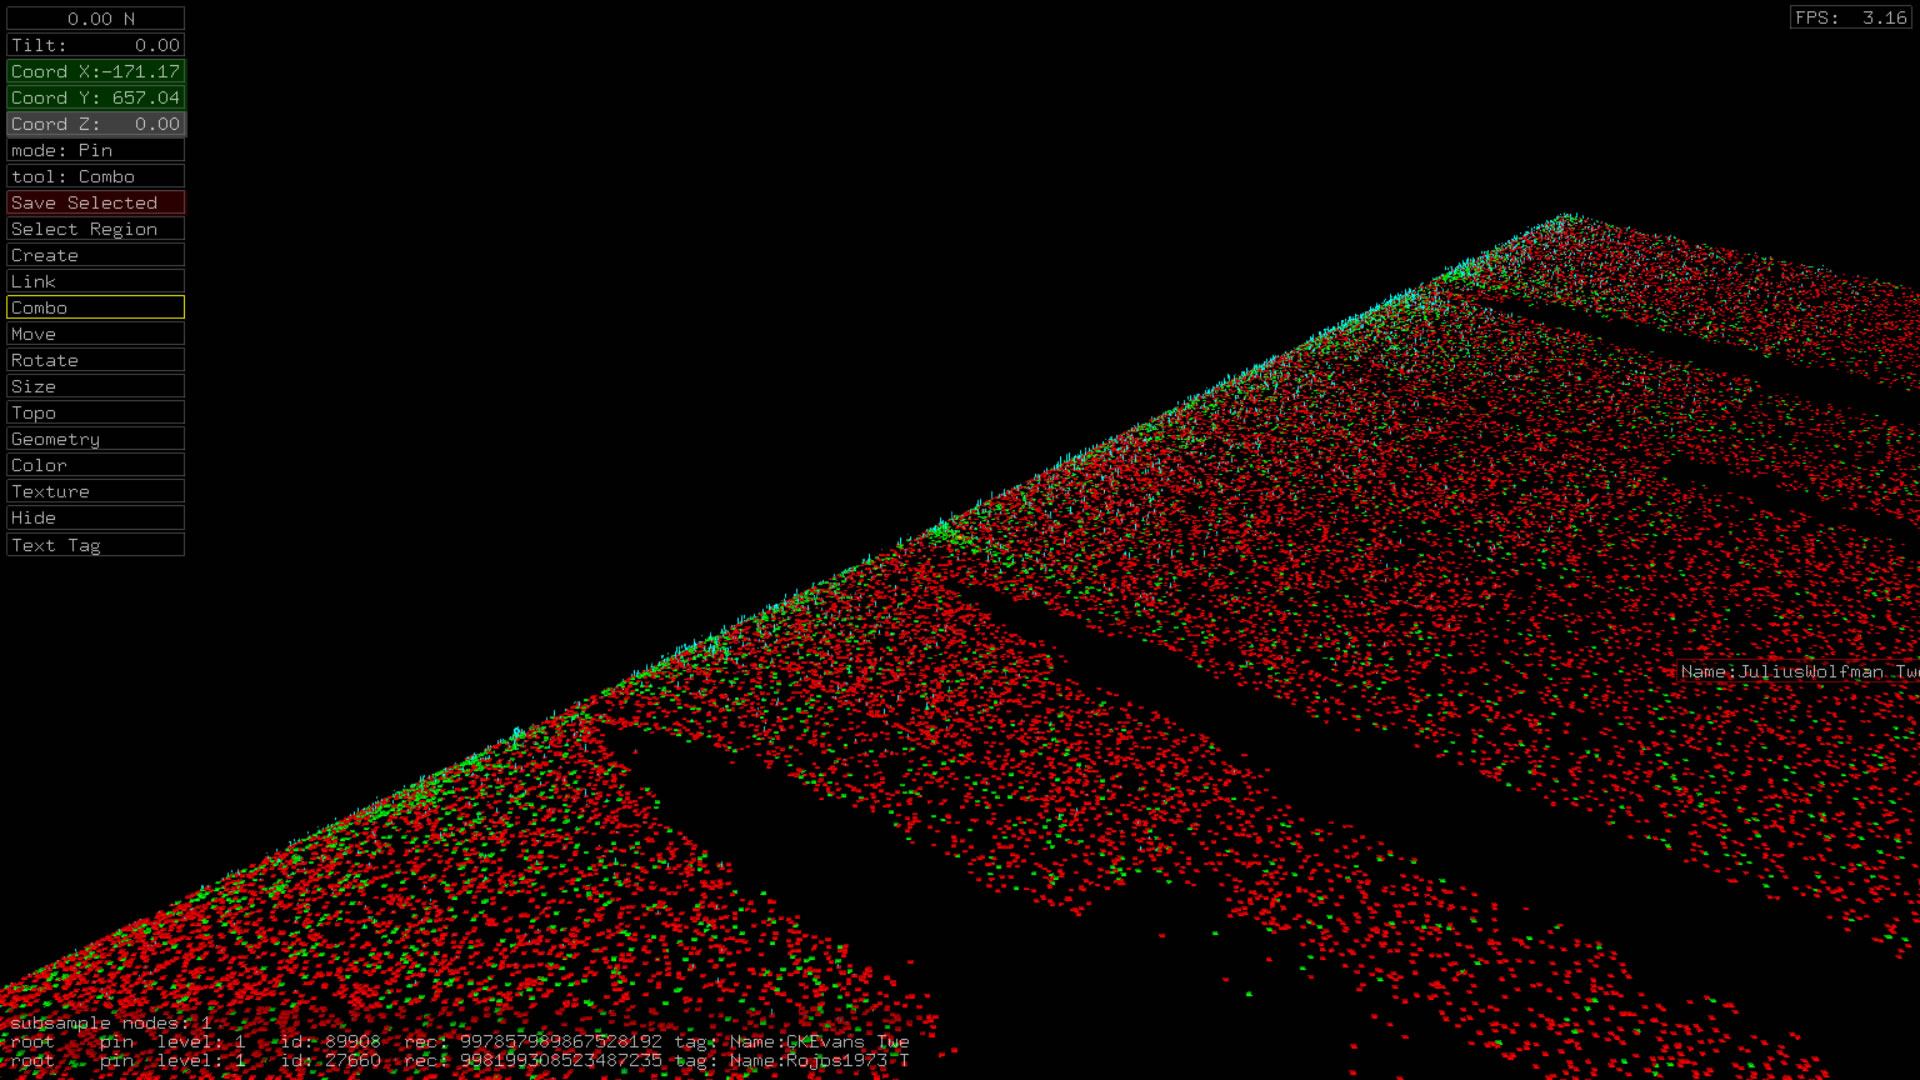
Several temporal gaps are prominent which appear to narrow as we approach the top tweeters.
A prominent demarcation line can be observed just above center where the follower counts appear to drop to zero. This line marks the top 11460th tweeter, approximately.
Several bursts of tweets can be observed, e.g. following the second a fourth gaps.
Time vs. Top Tweeters, May 17-June 5
Tweet Counts Per Sample
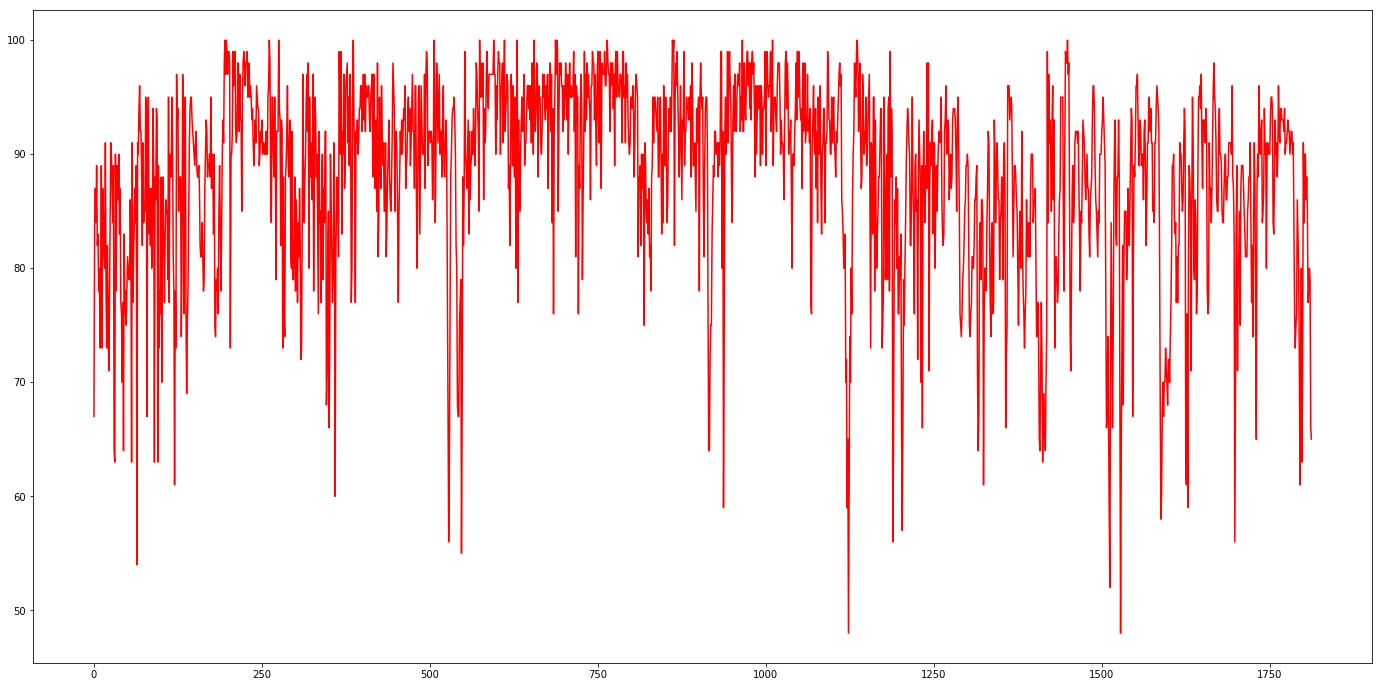
Distinct User Names Per Sample
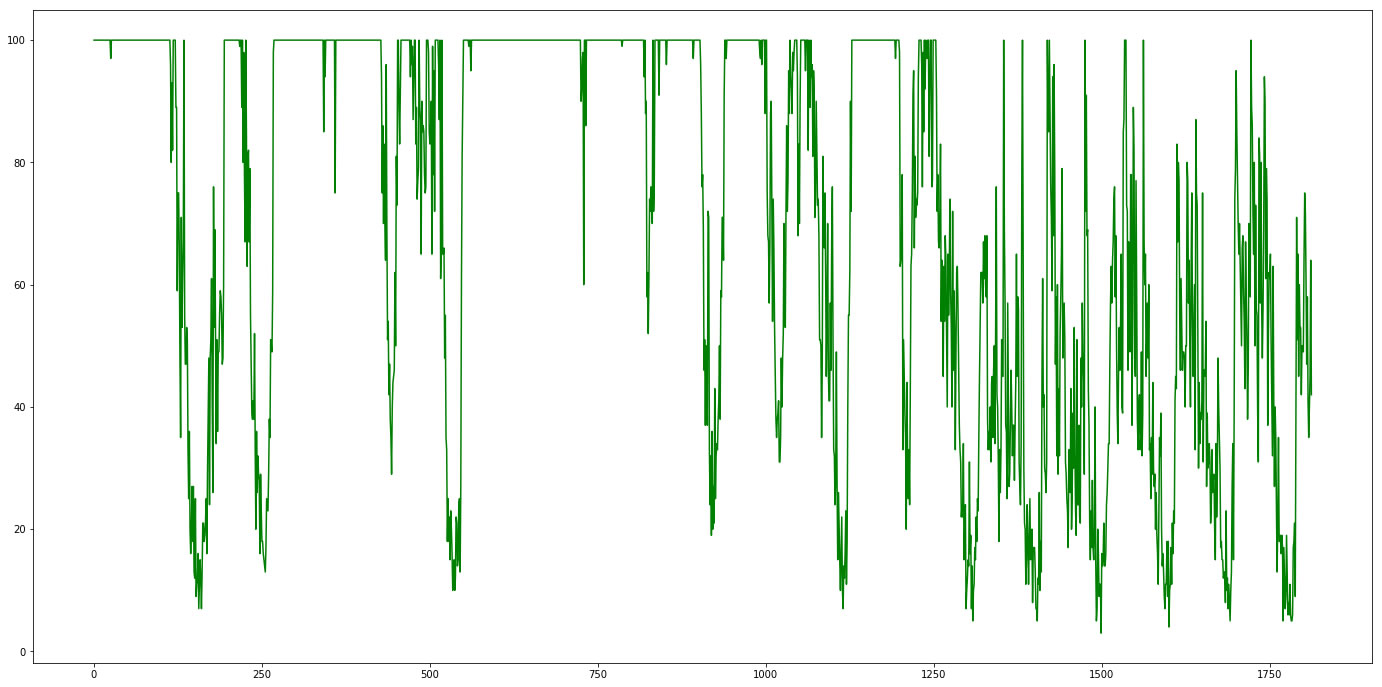
Unique Tweets Per Sample
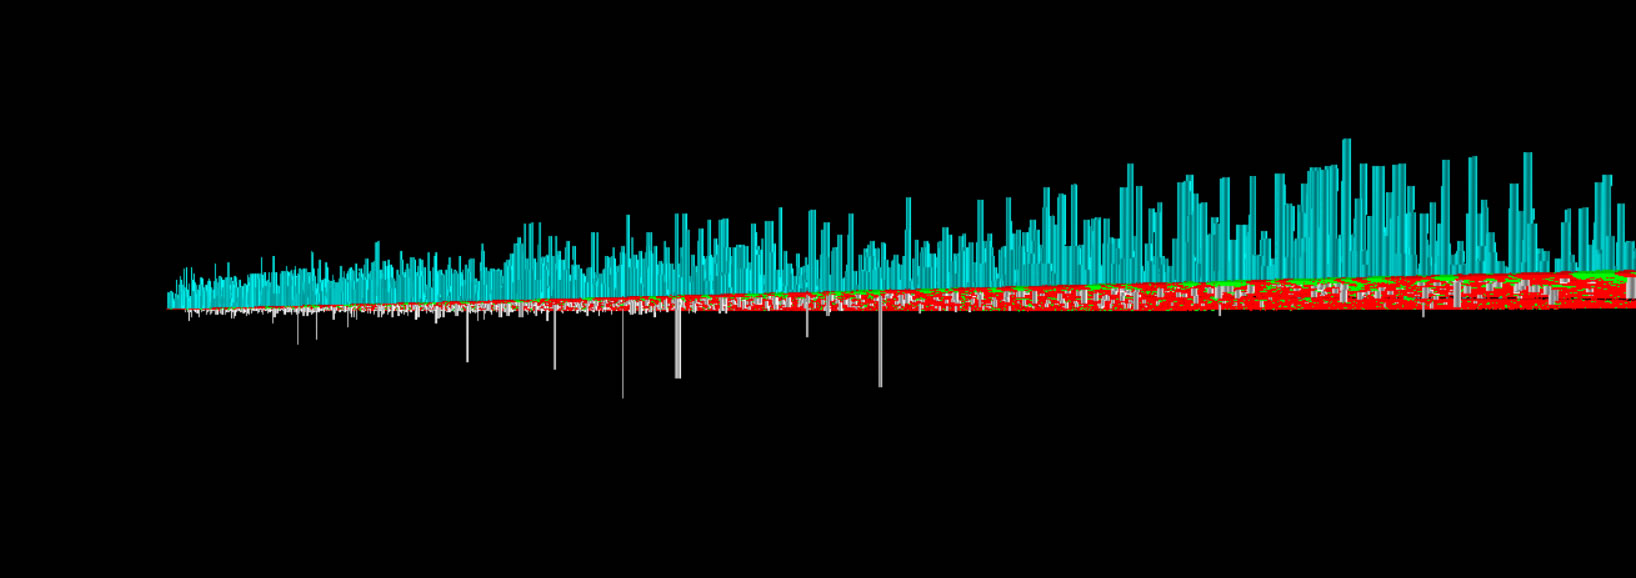
Follower Count Variation
Follower counts are typically greater for more frequent tweeters and also typically increase with time, thus leading to the appearance of growth towards a corner. Follower counts appear to drop to zero at a specific demarcation line just above center, at a value approximately for the 11460th top tweeter.
Decreases in follower counts occur far less frequently than increases.
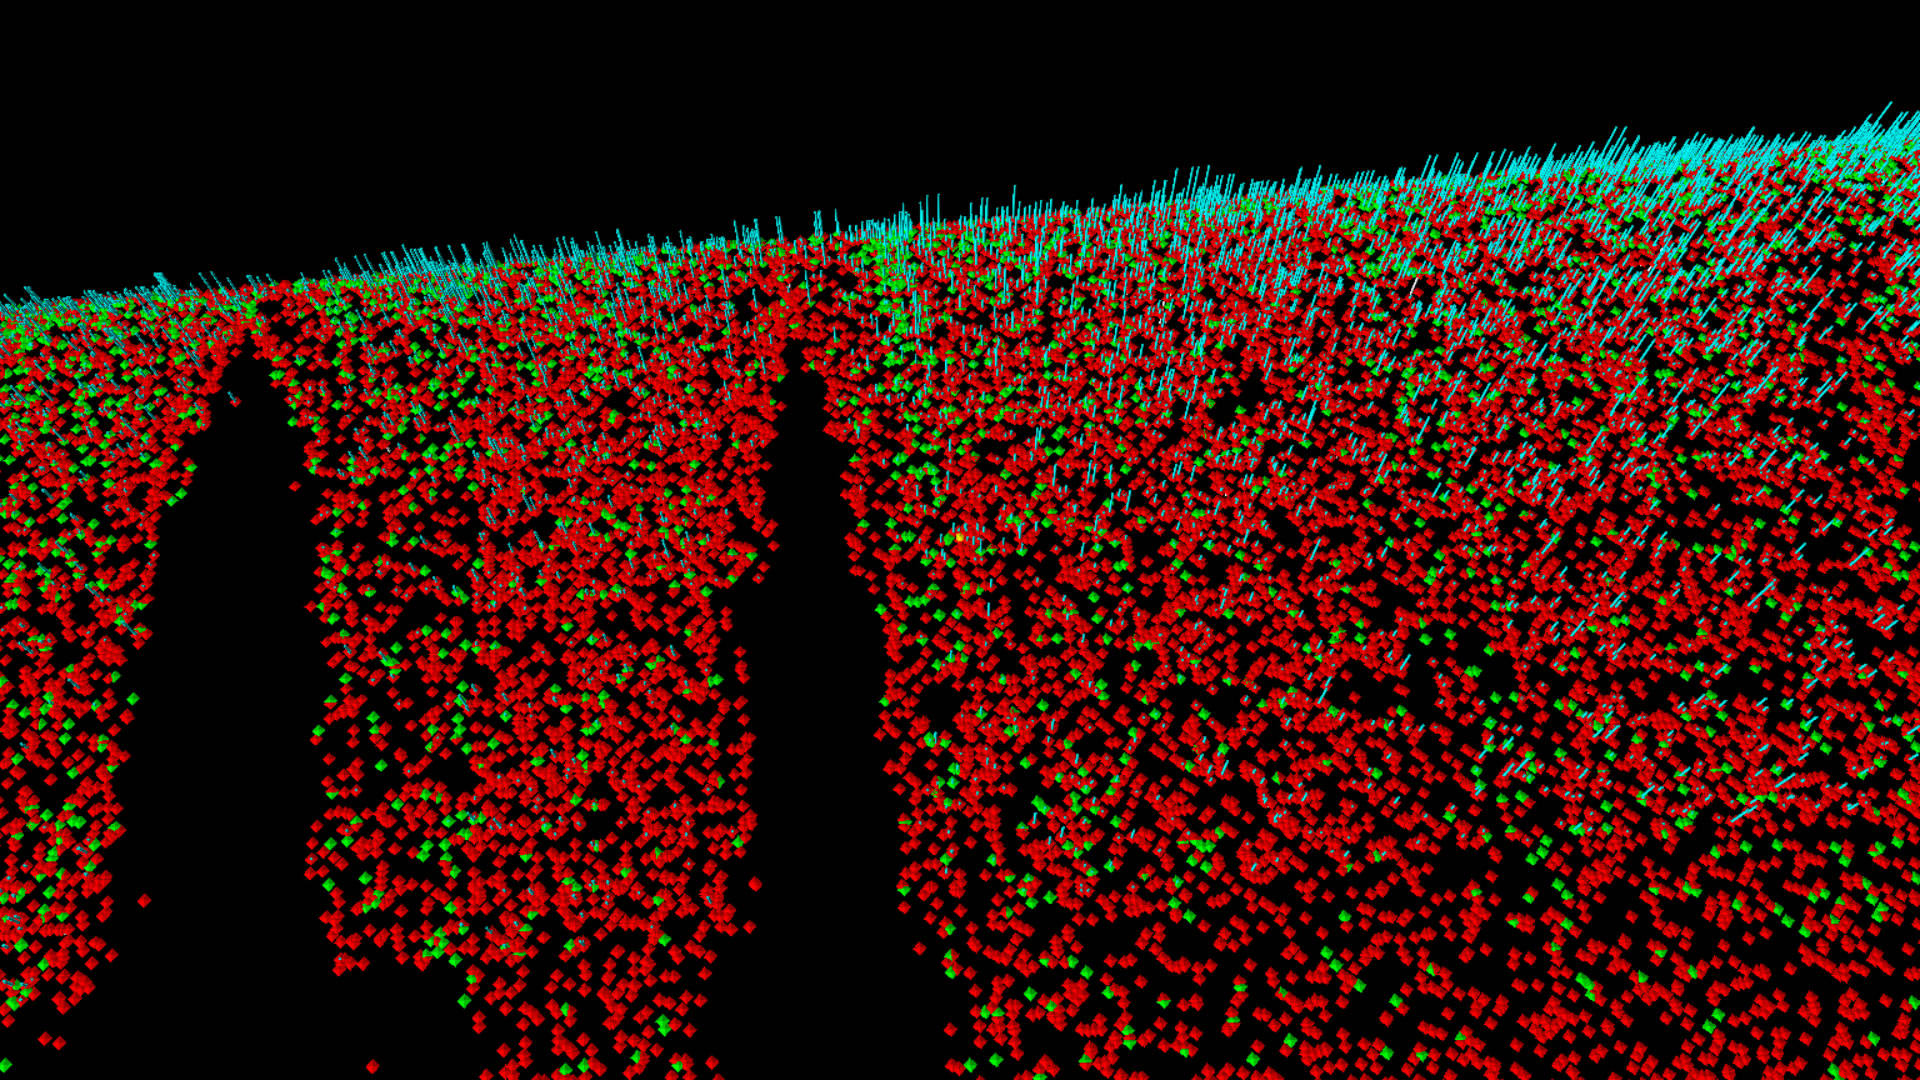
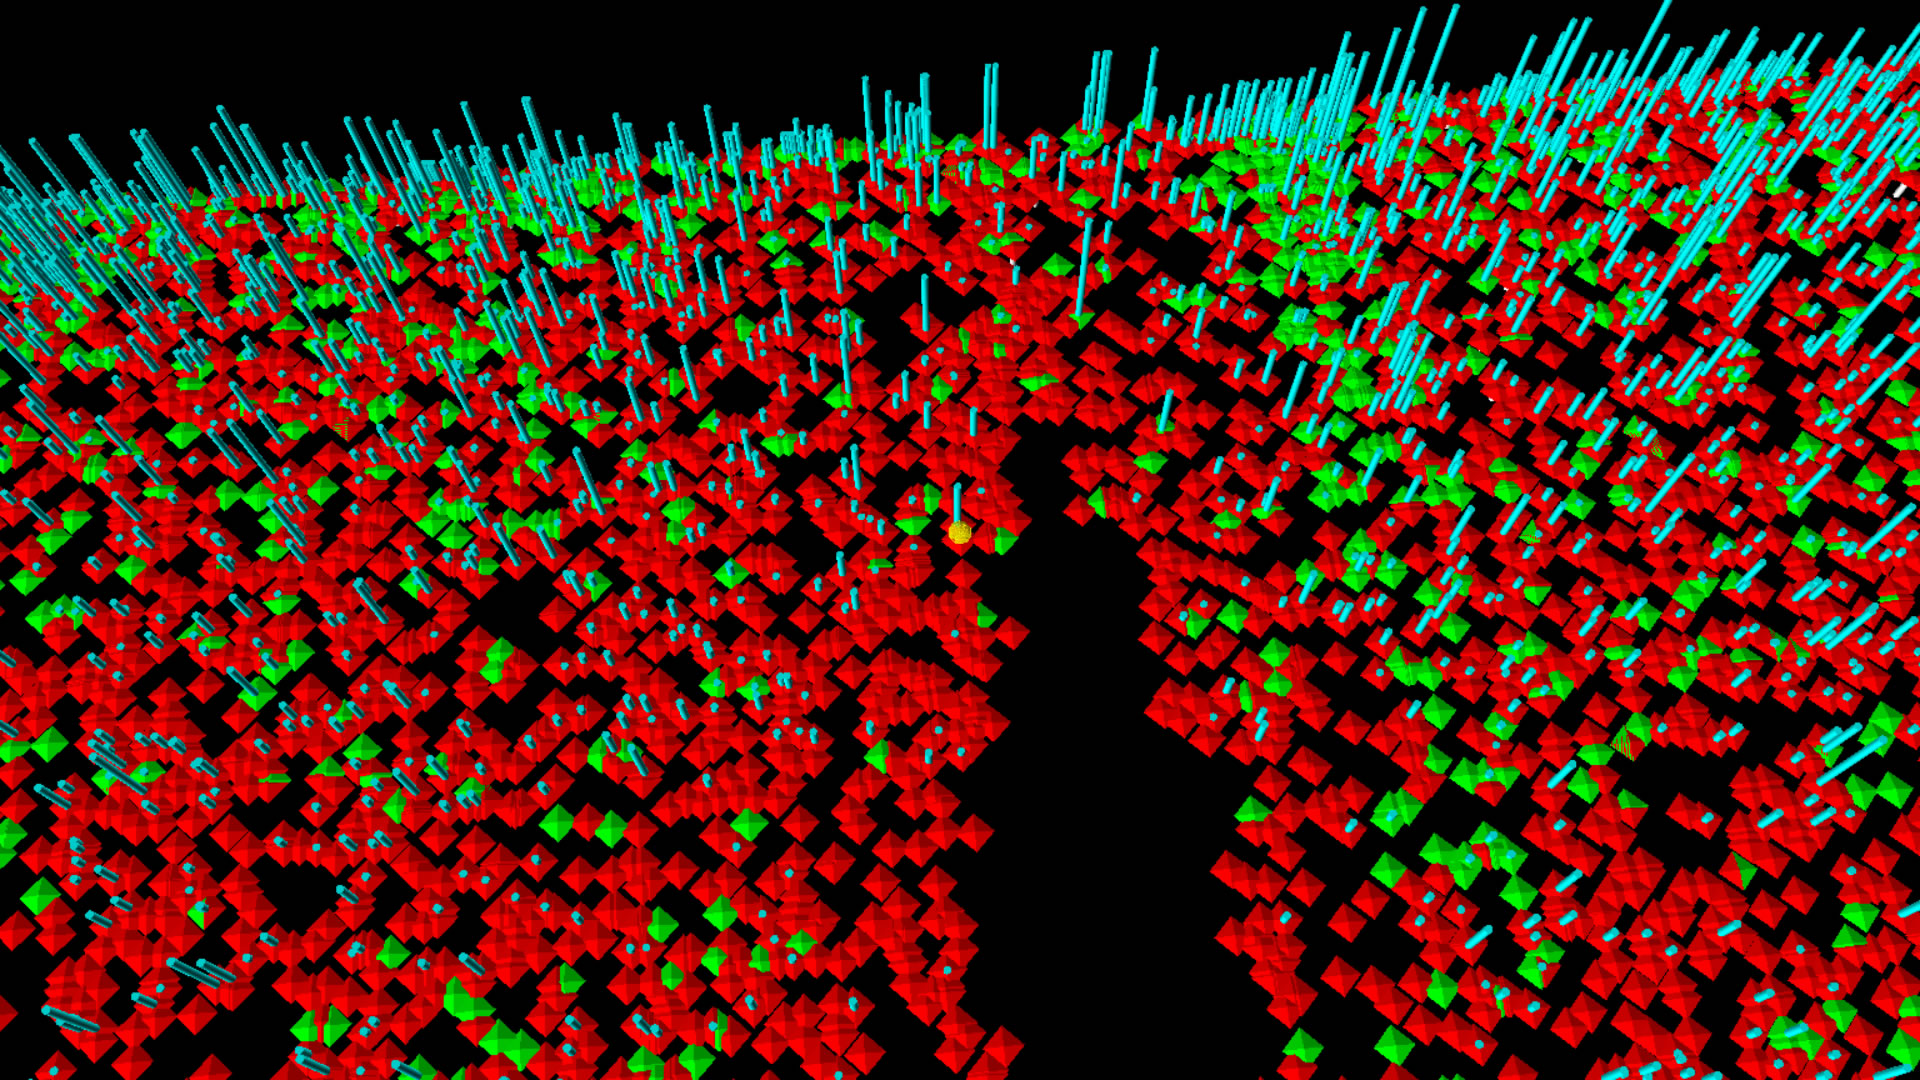
Interesting detail around the gap "heads". Density of retweets appears to increase and the gap is following by a tweet burst.
In the below image, geometries are scaled down in size to reduce the 'follower count fuzz" and make tweet bursts more obvious.
