Data Collection
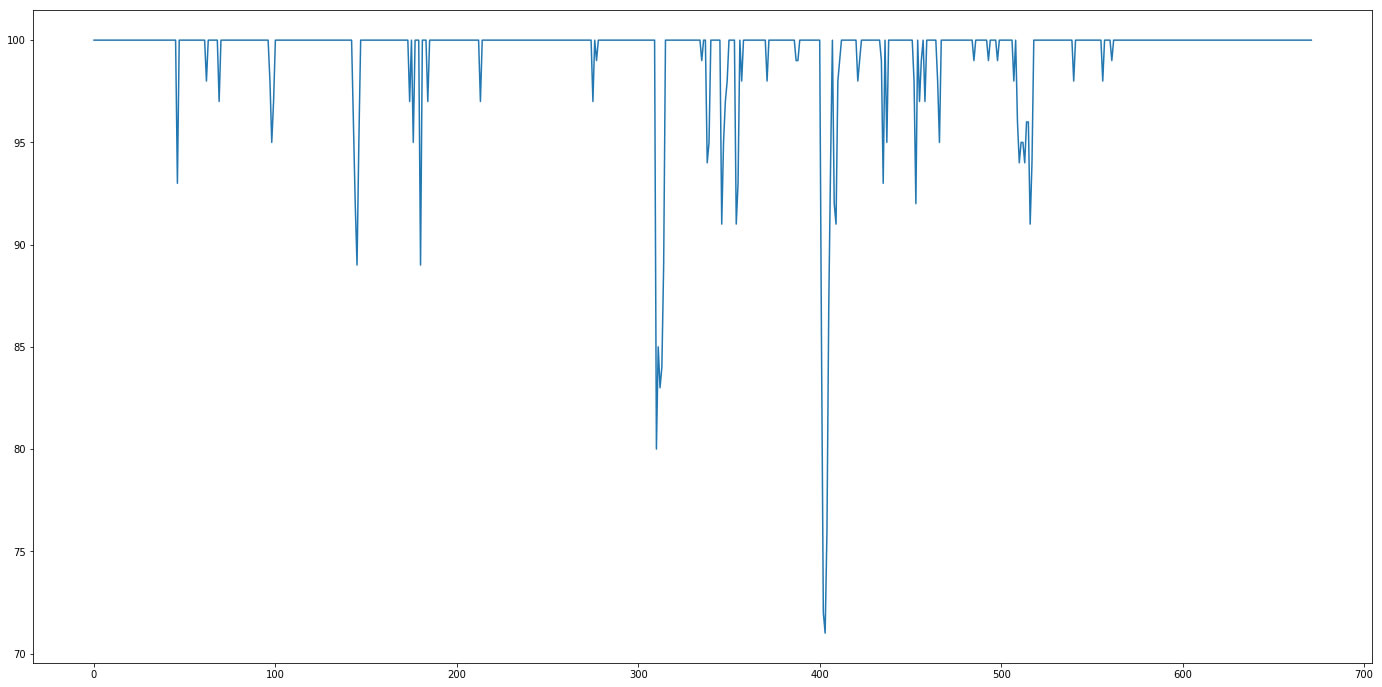
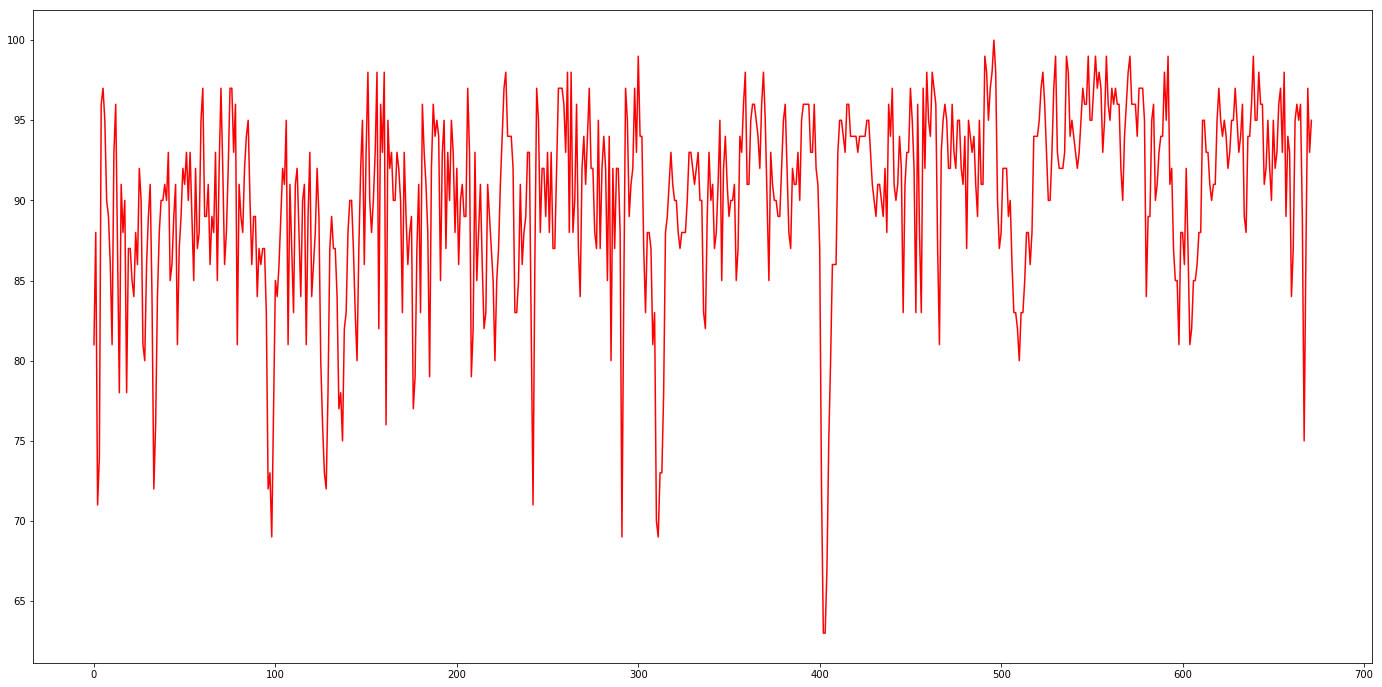
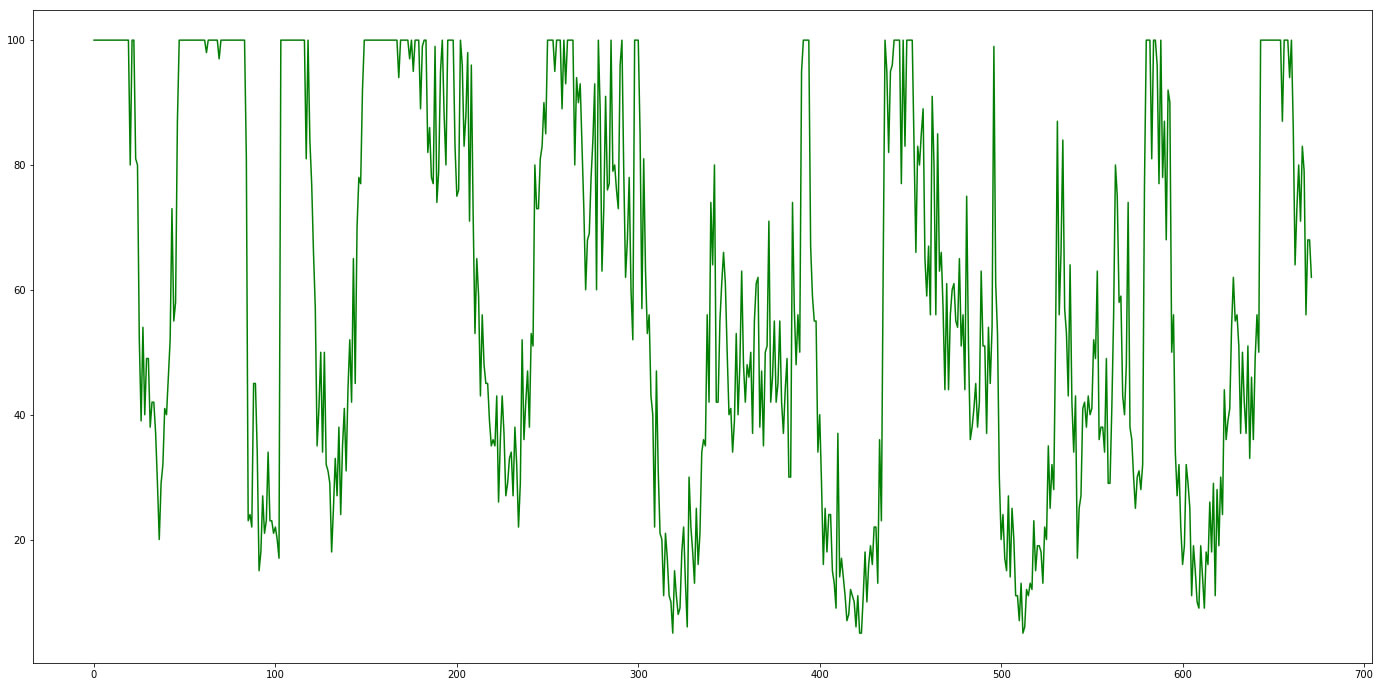
Data was collected for ~14 days, from April 5, 7:00pm through April 12, 6:00pm. Data was sampled using the Twitter Search API once every 15 minutes, 96 samples per day, 673 total samples, 66755 total tweets (some duplicates), and 20064 unique users. Each sample requested the maximum number of tweets allowed for free which is 100 tweets. Some samples fell short of this maximum (see figure for Tweet Counts Per Sample). Tweet data was saved as text files in json format.
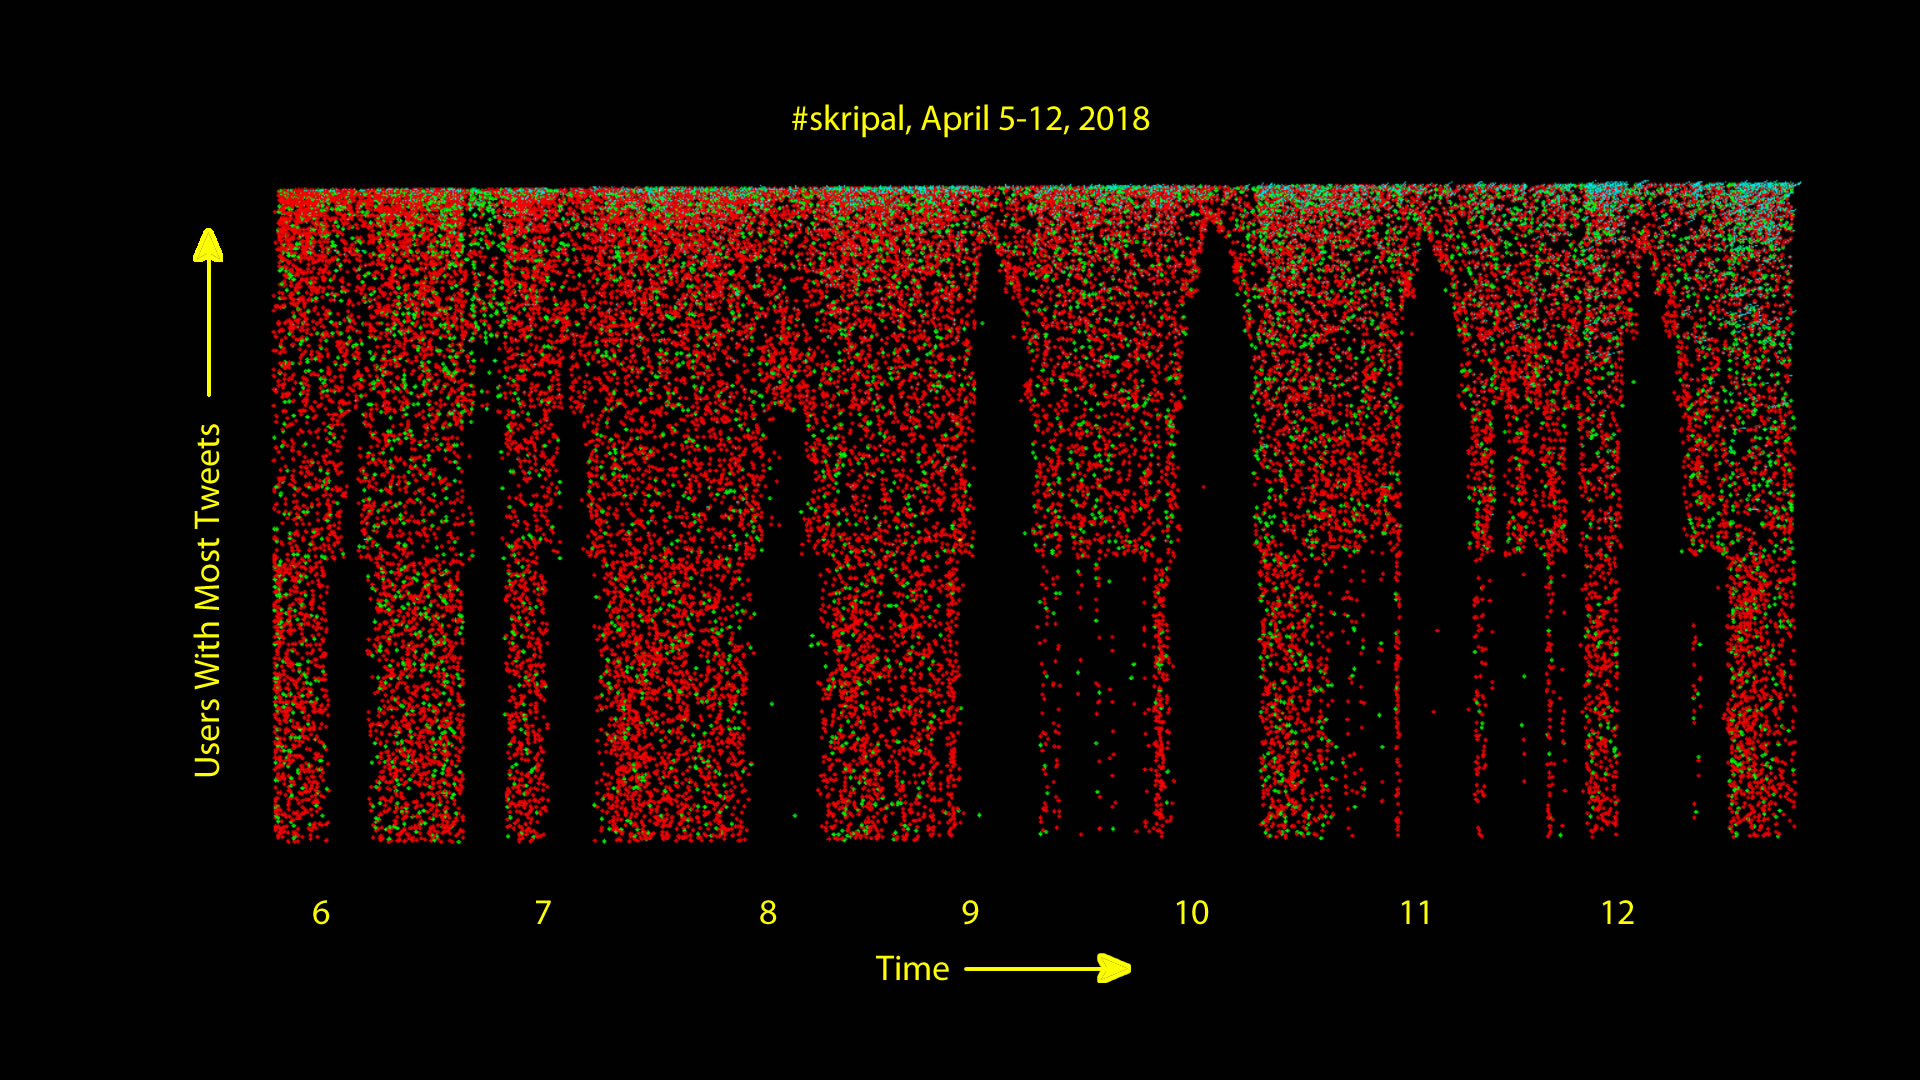
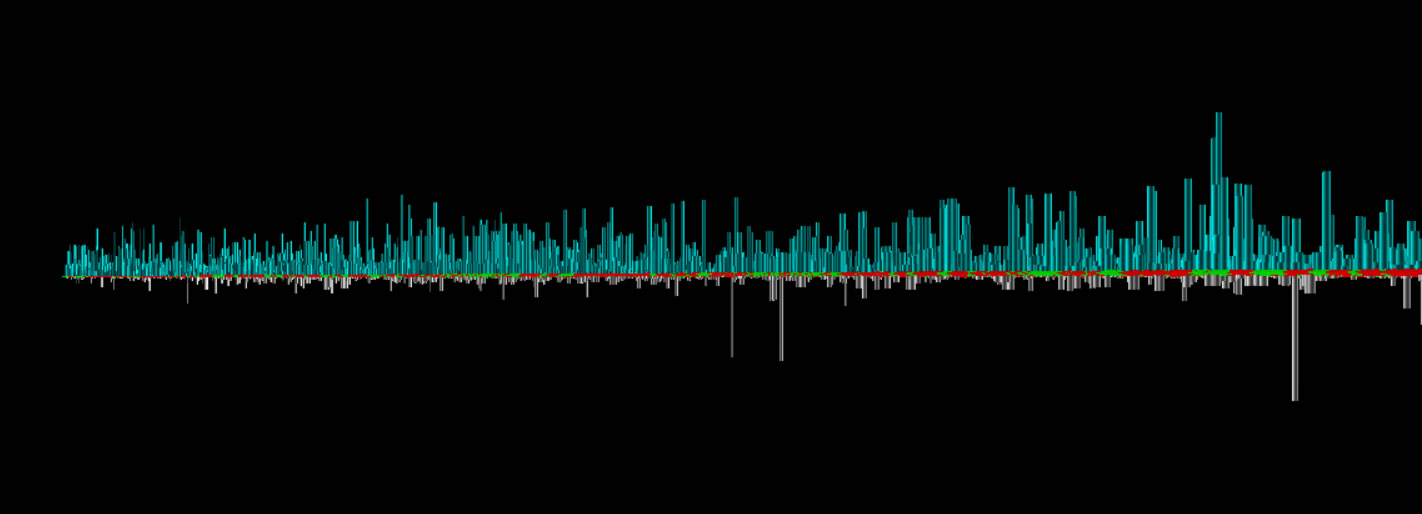
Time vs. Top Tweeters
Download ANTz visualization of time vs. top tweeters for Windows.
Download iPython Notebook to create ANTz visualization.
Numerous gaps are prominent which become narrow towards the top tweeters.
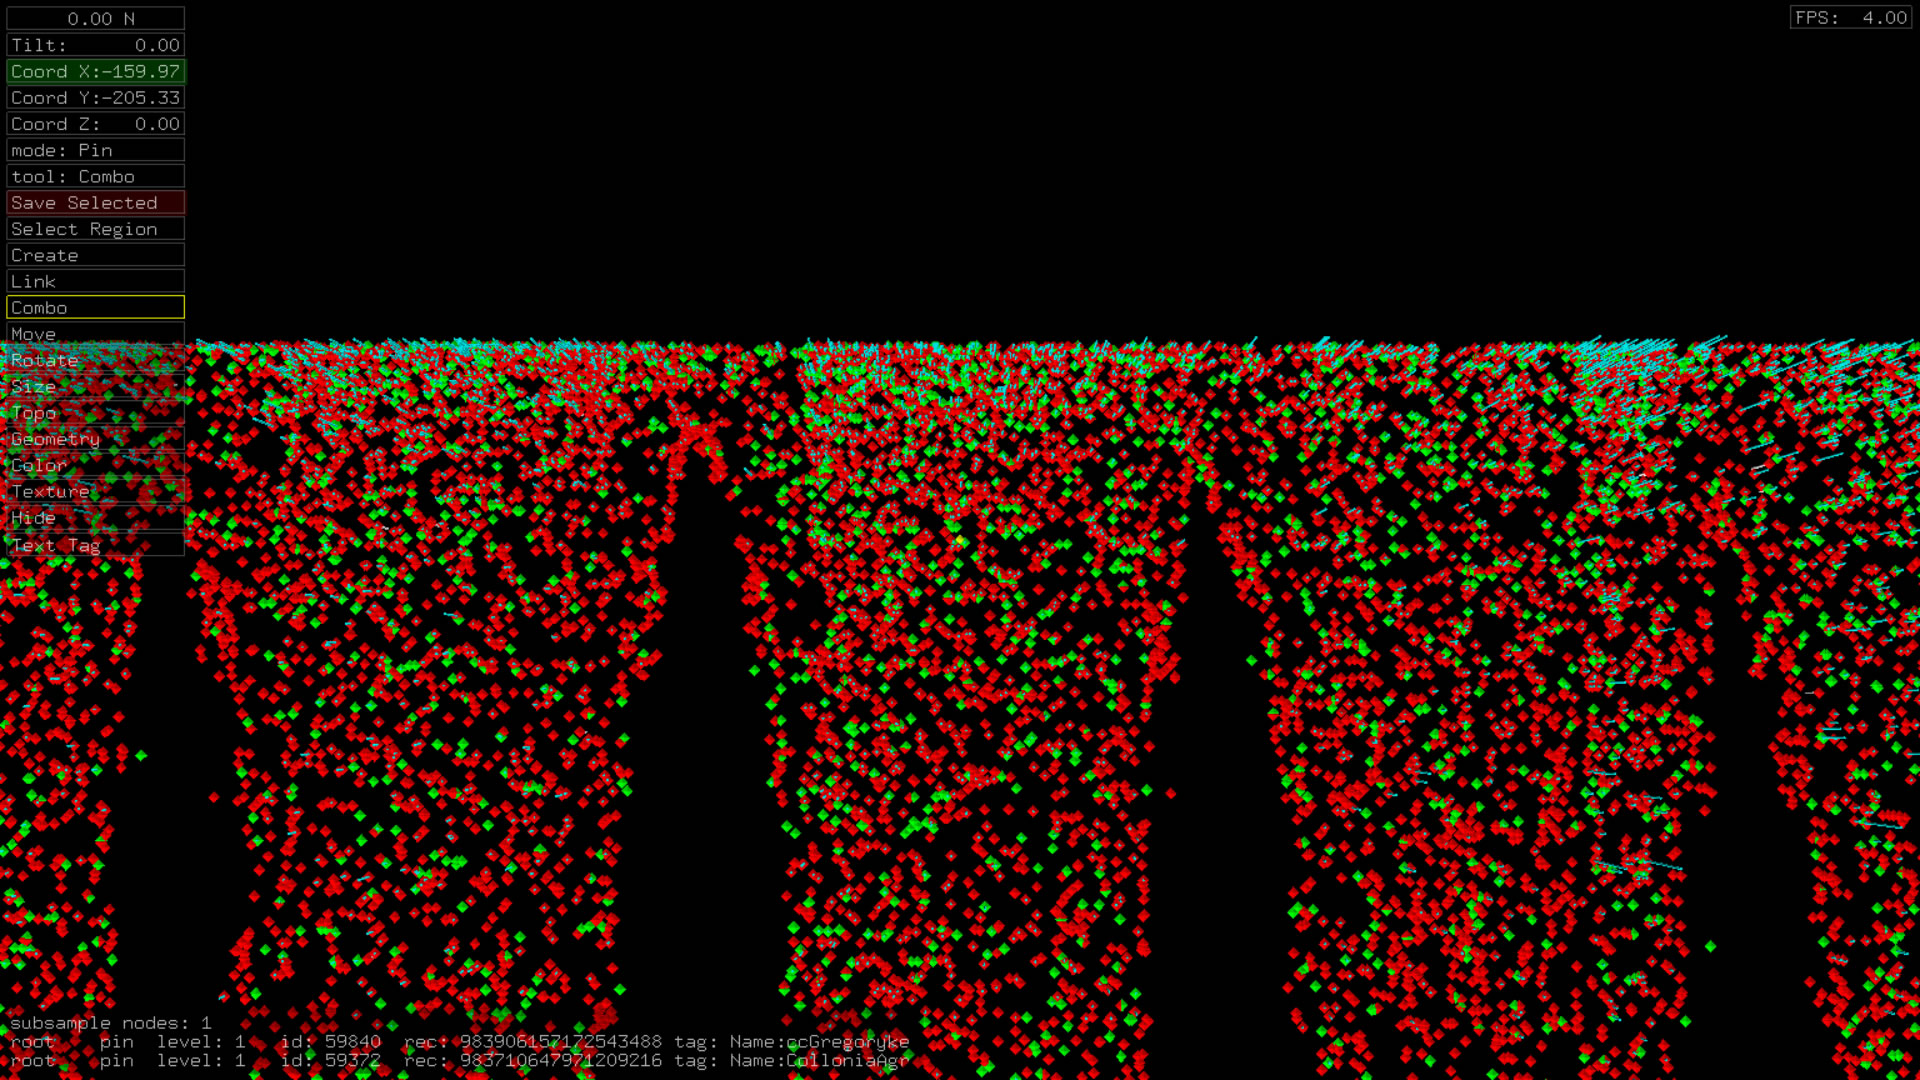
There were 20063 unique users. A prominent demarcation line can be observed where the follower counts appear to drop to zero. This line marks the top 11320th tweeter, approximately.
Tweet Count Per Sample
Distinct User Names Per Sample
Unique Tweets Per Sample
Follower Count Variation
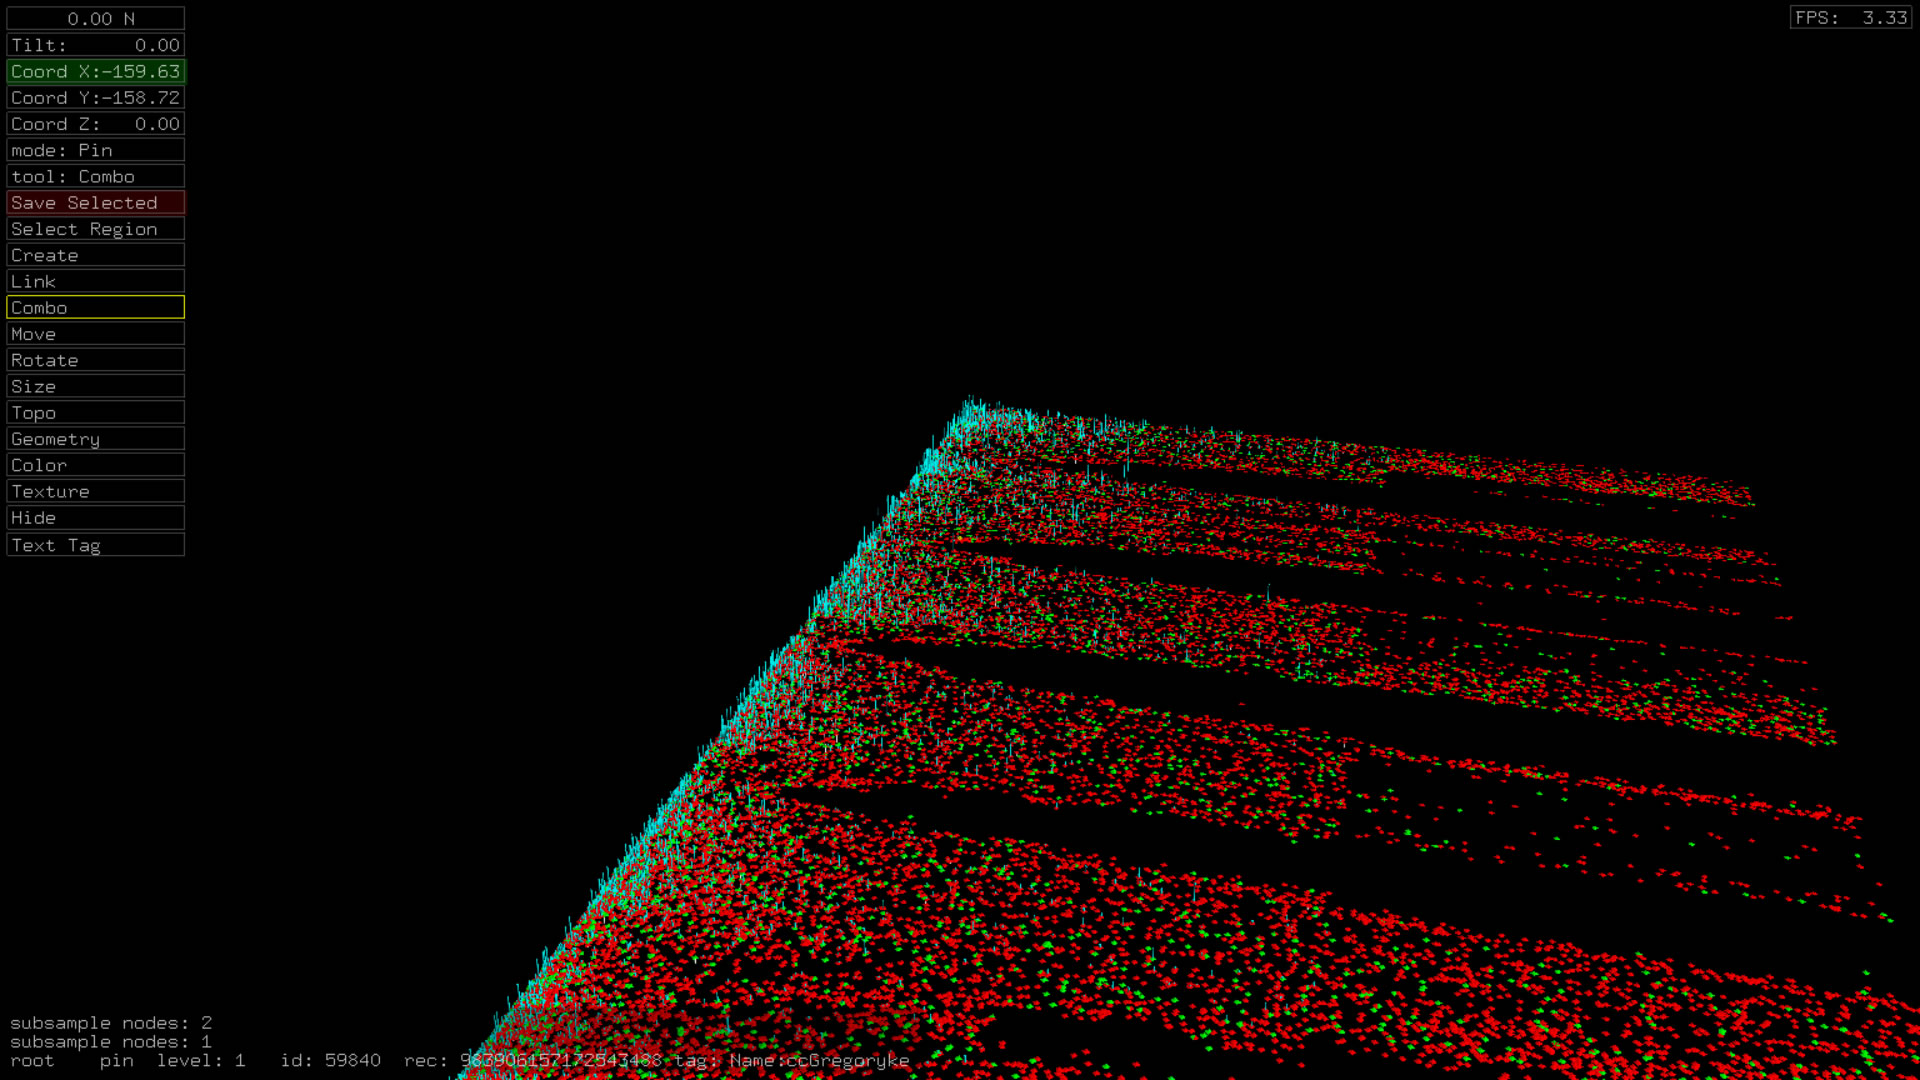
Follower counts are typically greater for more frequent tweeters and also typically increase with time, thus leading to the appearance of growth towards a corner. Follower counts appear to drop to zero at a specific demarcation line just above center, at a value approximately for the 11320th top tweeter.
Decreases in follower counts occur far less frequently than increases.
