Data Collection
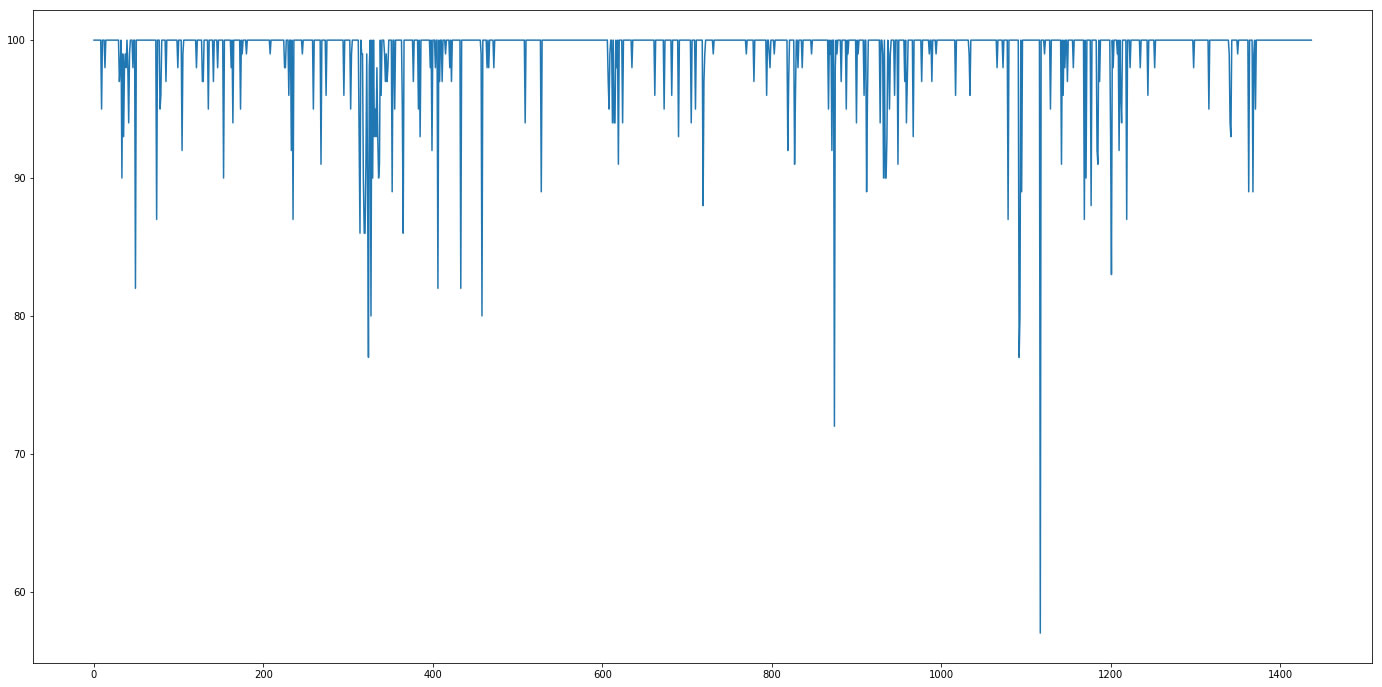
Data was collected for ~11 days, March 20 through 31. Data was sampled using the Twitter Search API once every 15 minutes, 96 samples per day, 1440 total samples. Each sample requested the maximum number of tweets allowed for free which is 100 tweets. Some samples fell short of this maximum (see figure for Tweet Counts Per Sample). There were 142618 total tweets, 62167 unique users. Tweet data was saved as text files in json format.
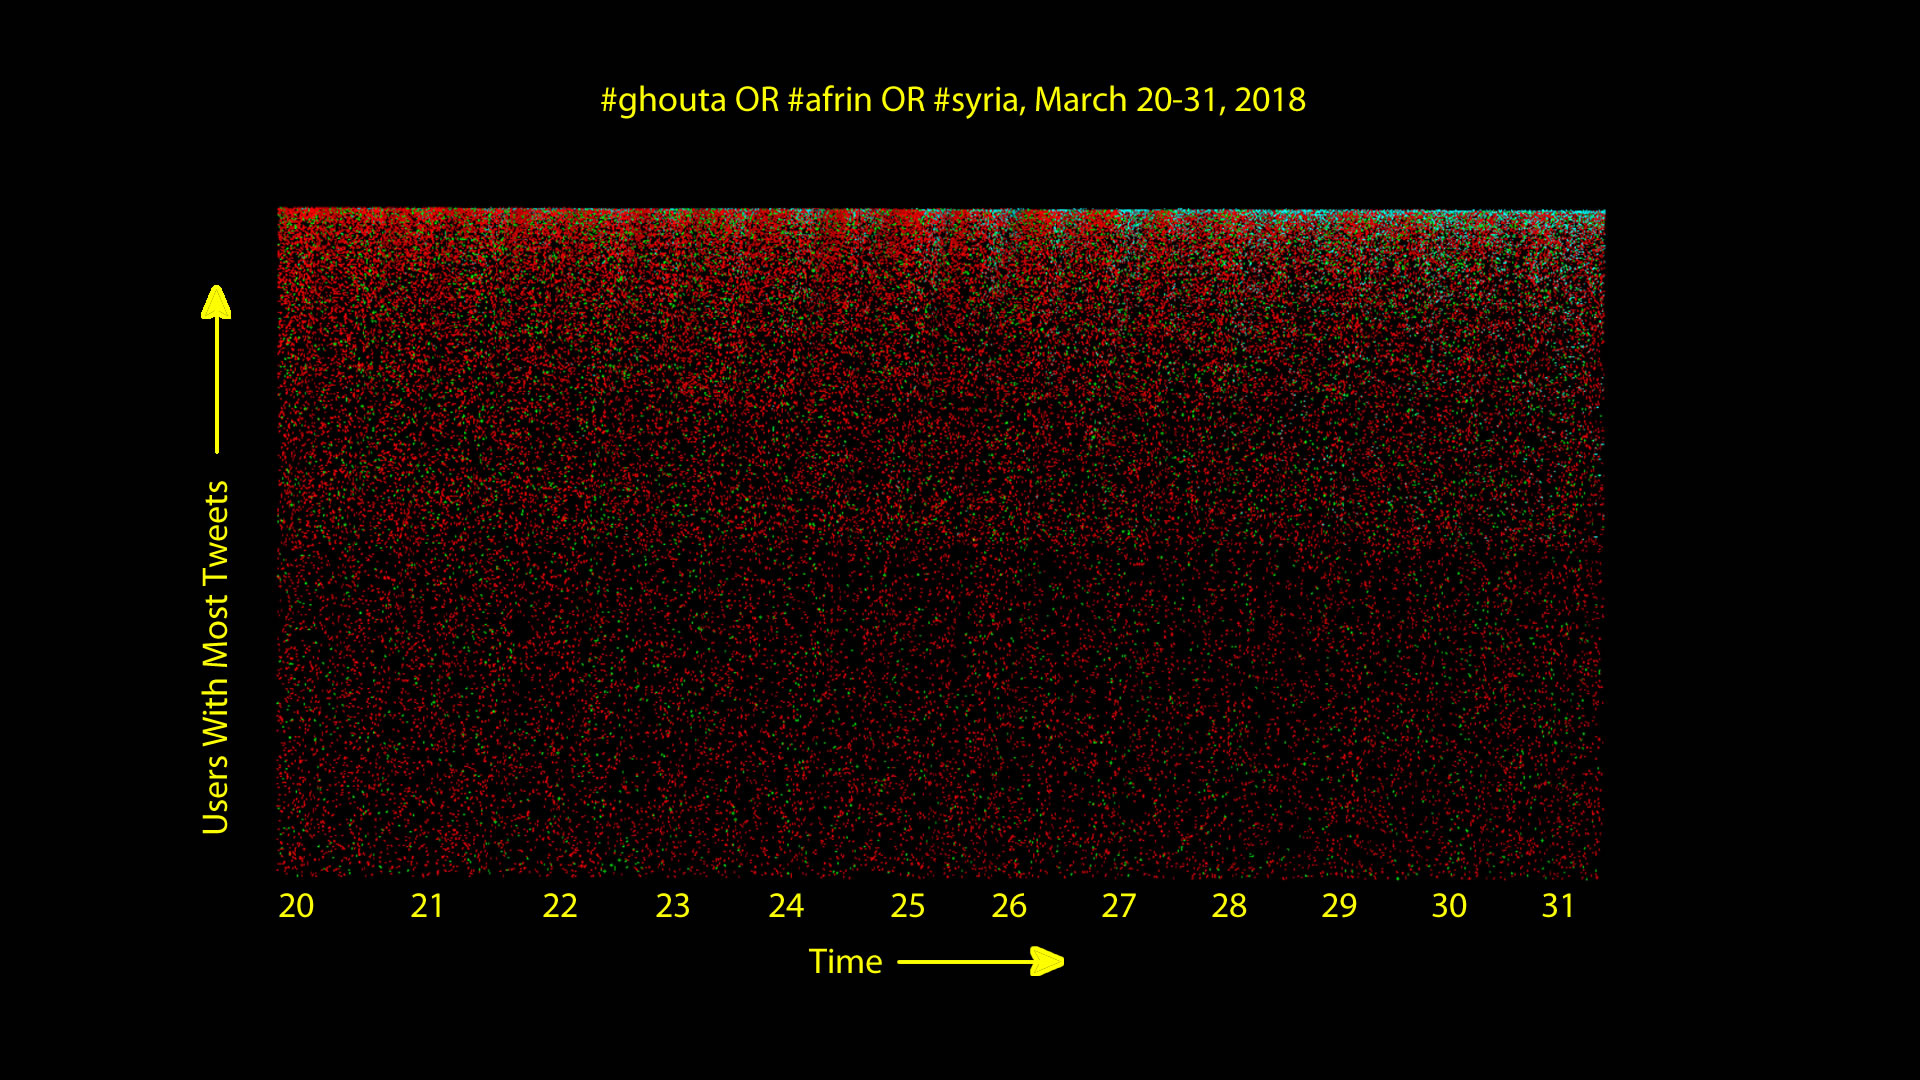
Time vs. Top Tweeters
Download ANTz visualization of time vs. top tweeters for Windows.
Download iPython Notebook to create ANTz visualization.
Tweet distribution is much more homogeneous than for #trumpcolluded. A slight day/night cycle can be observed.
Tweet Counts Per Sample
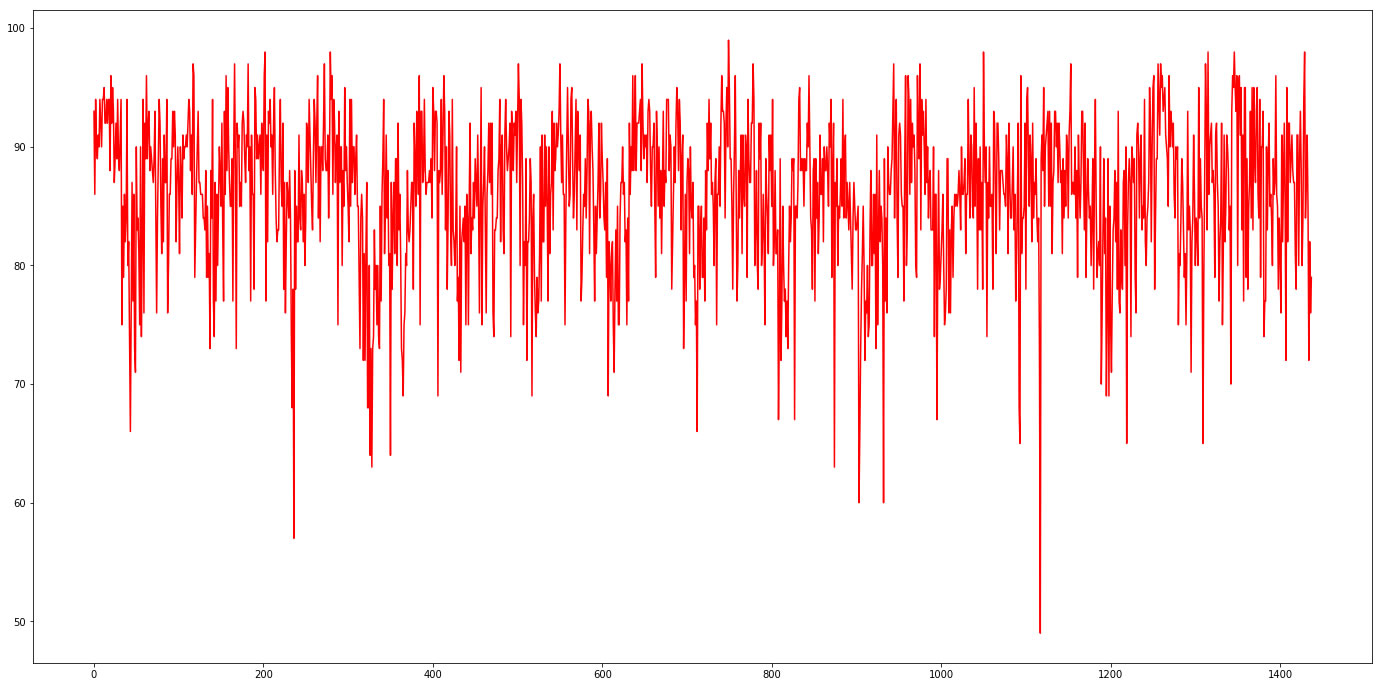
Distinct User Names Per Sample
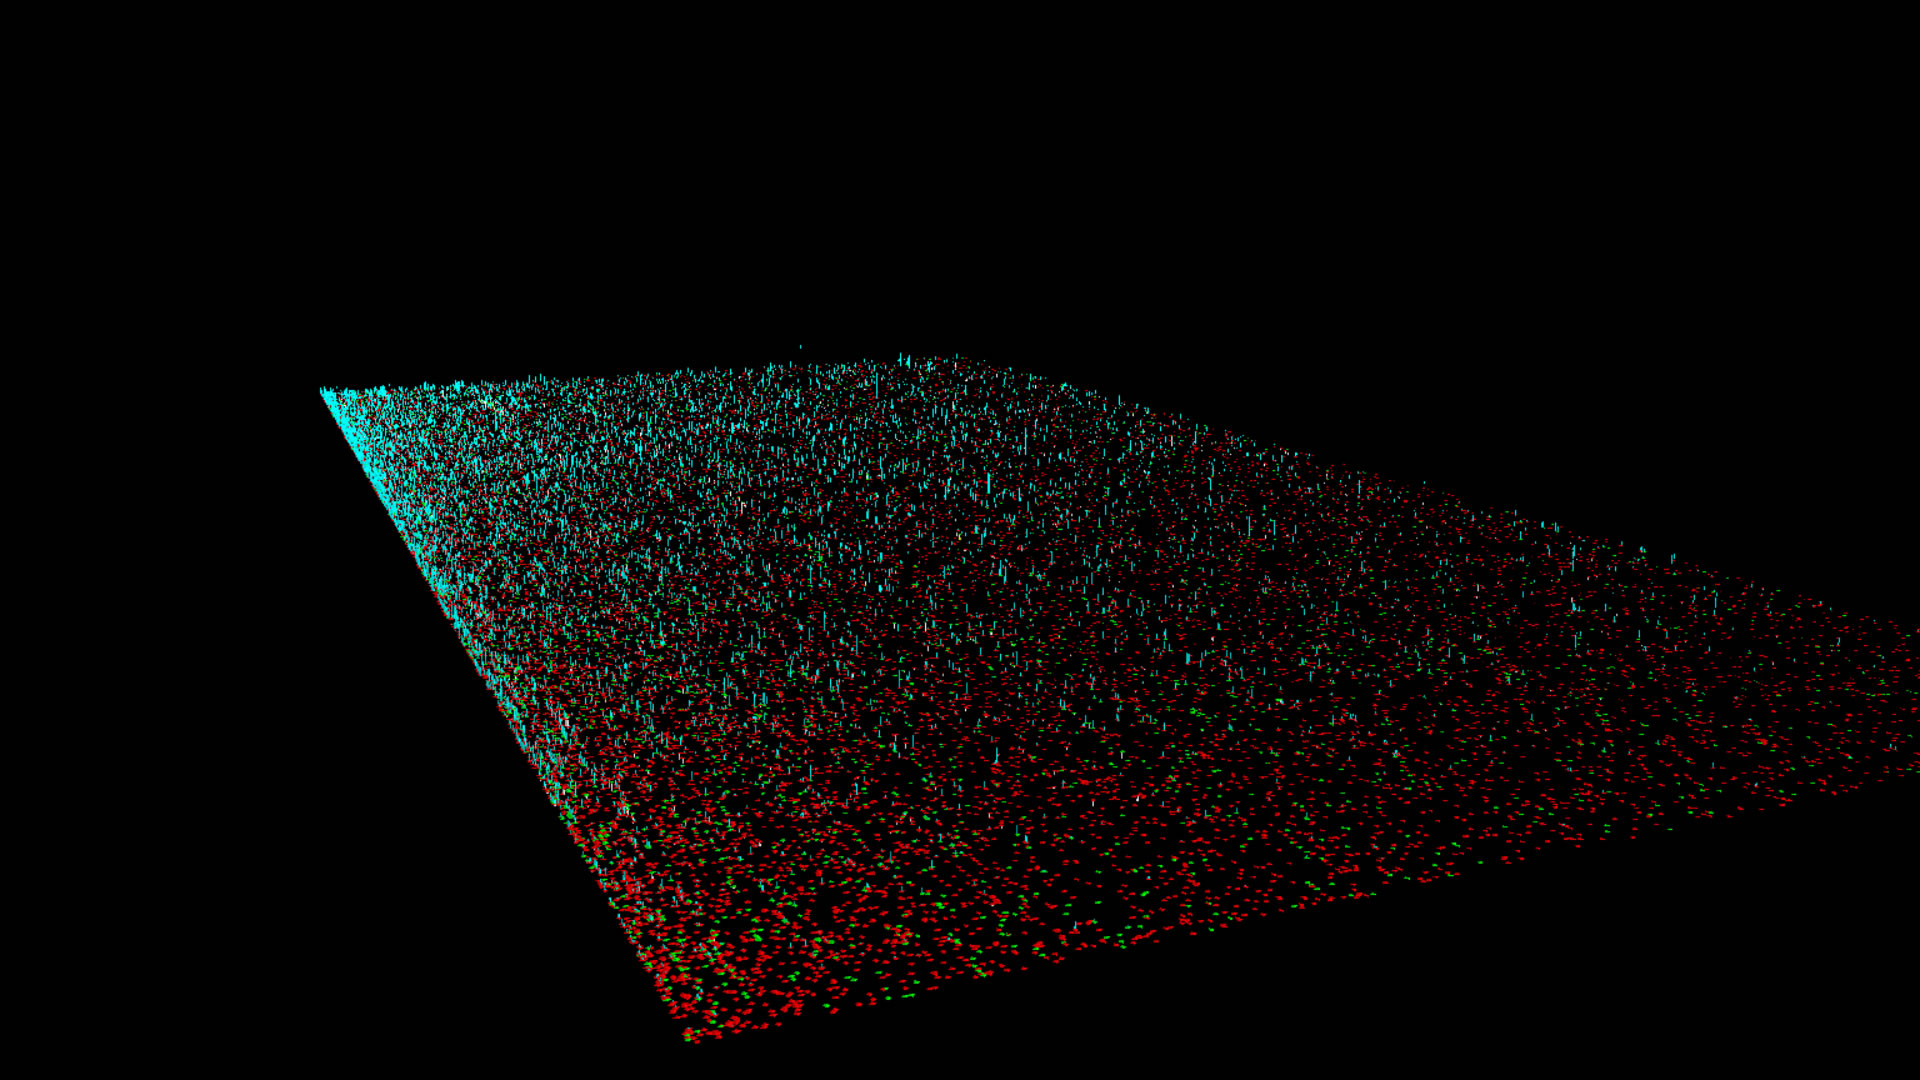
Follower Count Variation
Follower counts are typically greater for more frequent tweeters and also typically increase with time, thus leading to the appearance of growth towards a corner. Follower counts are more evenly distributed than those for #trumpcolluded and there appears to be a more even distribution of decreases vs. increases in follower counts.


