The Breathing Century
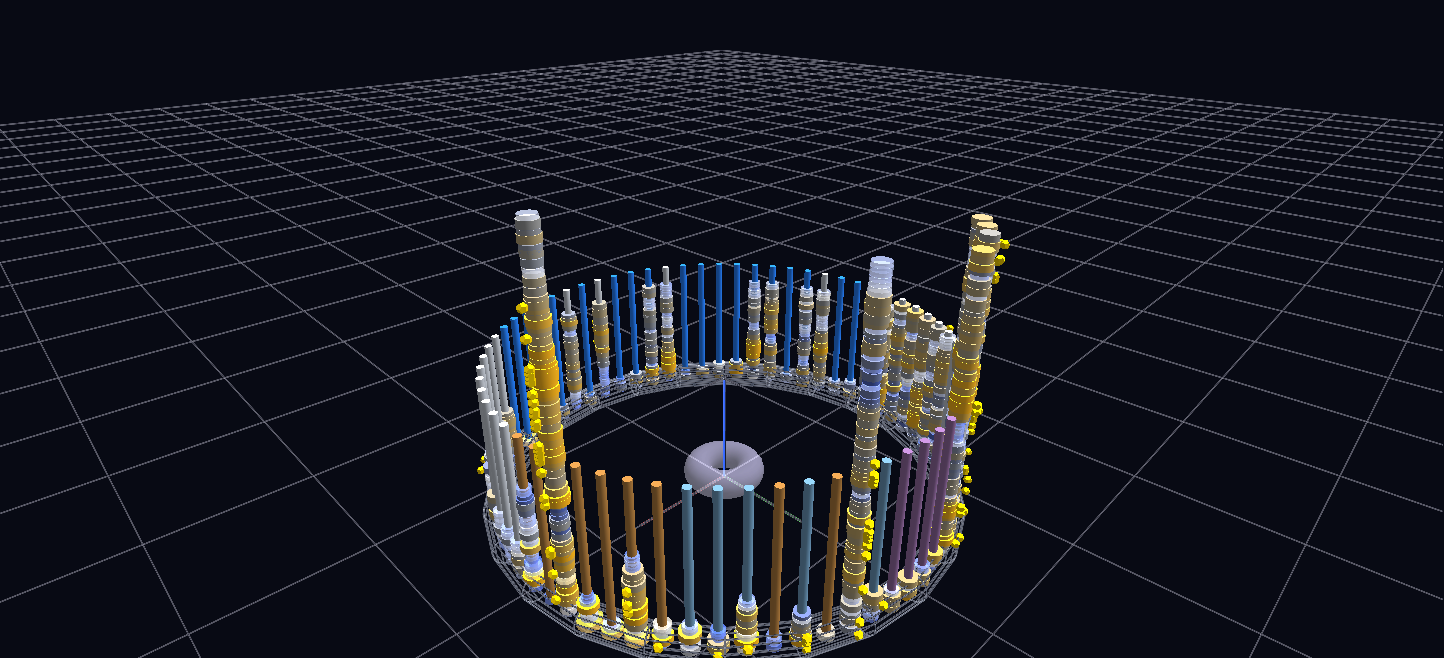
A century of NHL hockey (1909–2012): every franchise stands as a vertical tower of season discs on a founding-order ring — disc width is points percentage, color runs outscored-blue through silver to dominant-gold, and gold dodecahedra hang at Stanley Cup heights. Channels replay it as a growth animation, one step per season.
Try it: download this example below (or the full examples set), then open Breathing_Century_Example/century_reef_gv_node.csv — or just drag its folder onto the GlyphViz window. Press Space to start the animation.
Download this example (550 KB)
What it is
A hundred and three seasons of professional hockey, from 1909–10 to 2011–12, drawn as a reef that grows. Every franchise that ever played is a vertical tower standing on a ring, and each tower is built of one disc per season. Press play and the reef is built in front of you, one season per step: every disc starts invisible and snaps solid in the year it happened. In the middle, a translucent torus breathes in and out with how many goals the league was scoring.
With playback off you see the finished reef, all 65 franchises at once.
How to read it
| What you see | What it means |
|---|---|
| The ring of towers | franchises in the order they were founded. Walk around the ring and you walk through the history of the league. A tower's base is coloured by the league it started in |
| A tower of discs | one franchise. The discs are its seasons, stacked in order, so a tall tower is a long-lived team |
| Disc width | points percentage, so a wide disc is a strong season |
| Disc colour | deep blue for a season in which the team was outscored, through silver, to gold for a dominant one (the goal difference per game) |
| A ghosted, see-through disc | a season that missed the playoffs |
| A gold dodecahedron beside a tower | a Stanley Cup win, hung at the height of the winning season |
| The tide at the centre | a translucent torus that swells and warms from cold blue to hot orange with league-wide goals per game |
The tide is the quiet storyteller. Its label gives the range, 2.92 to 12.93 goals per game. It is cold and small when scoring was low, big and hot when it was high, and it holds its breath, unchanged, through the 2004–05 lockout when there was no season to count. Because the data is rates, not totals, a 1919 season and a 2010 season read identically: a wide, gold disc means the same thing in both.
Click any disc for its line, for example 1909-10 Cobalt Silver Kings [NHA] - 8 pts (4-8-0) GF 79 / GA 104.
Things to try
- Watch a dynasty arrive. Orbit to the tower of a team you know and play the century: its gold discs and Cup markers appear in step.
- Find the gaps. Franchises that folded or moved stop growing. A short tower is a short life, and the ring still shows where the team sat in the founding order.
- Stop mid-way and drag the Channels slider to freeze the reef at any season.
How it is built
The reef is 1,687 nodes: the World row, the ring, a hub and the tide, then 65 franchise pedestals (Rod topology, so the discs stack along each tower) and 1,618 season discs and Cup markers. Every label is inline, so the scene is a node file plus its two Channels files.
The animation is the interesting part. About 1,700 glyphs are animated by only 204 channels, because every node born in the same year with the same final transparency shares one channel. Appearing is a step-function on color_a: zero before the year, the final value from then on. The tide is one track feeding scale_x/y/z on a single channel, plus three more tracks for its red, green and blue.
The clock has 103 steps, one per season. Gaps in the source data, which have no row for a missing season, carry the previous value forward so the shared clock never falls out of step, and that is what makes the tide hold its breath in 2004–05.
The generator, build_breathing_century.py, ships with the scene. Point its HOCKEY_DATA setting at the folder of hockey history CSVs to regenerate it.