California STAR Test Scores
California STAR standardized-test scores (San Diego Unified, 2003–2012): one tree per school and year, fanning into demographic subgroup branches and real CST/CAPA test-score branches.
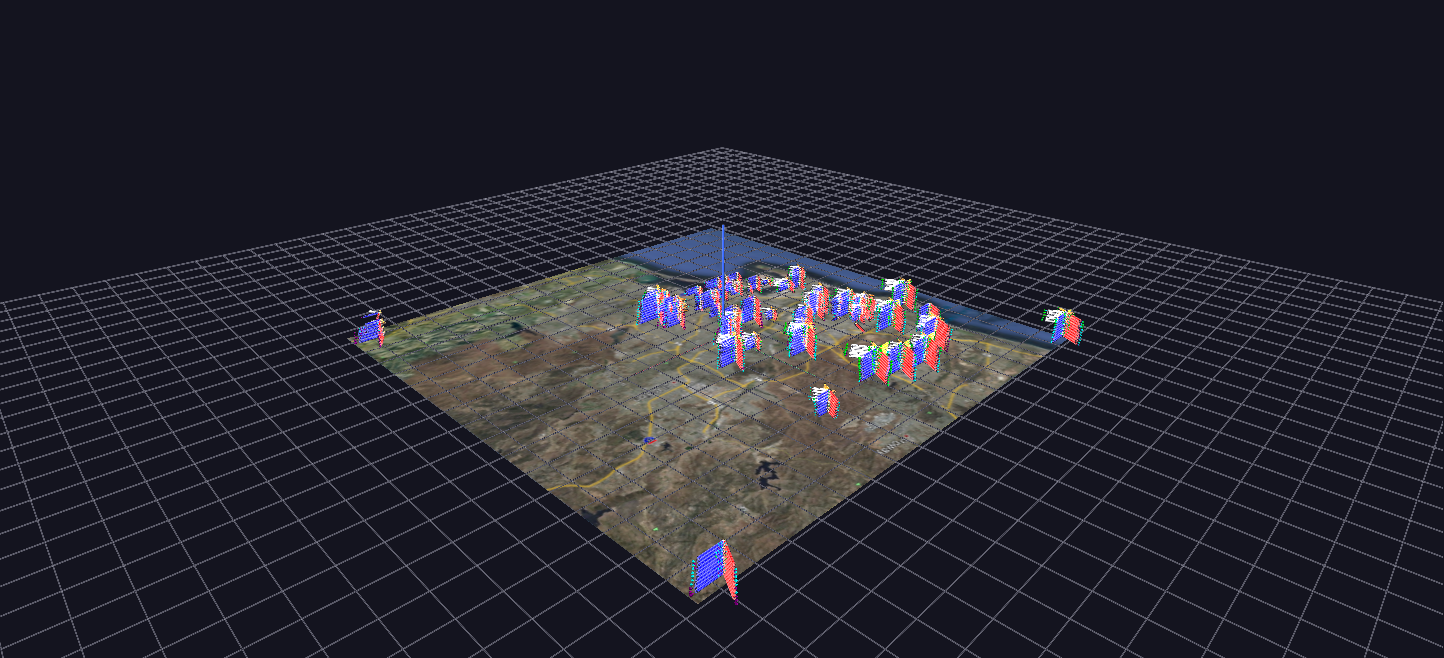
Try it: download this example below (or the full examples set), then open CalStateTesting_Example/CalStateTesting_Example_gv_node.csv — or just drag its folder onto the GlyphViz window.
CalStateTesting_Example (9 MB) AchievementGap (8 MB) GradesCube (9 MB)
What it is
Ten years of standardized test results for the San Diego Unified School District, from 2003 to 2012, drawn so that every school in the district is a small tree standing on a map of the county. A school's tree is tall where it has been measured for many years, because each year is stacked above the last, and each tree branches into the student groups that sat the tests and then into the individual tests.
The folder holds three scenes made from the same data. The main scene is the one this page describes; the other two read the data a different way, and each has its own download button above.
| Scene | Nodes | What it shows |
|---|---|---|
| CalStateTesting_Example | 8,320 | grade 8 only: one tree per school per year, branching by demographic group |
| AchievementGap | 5,839 | the same schools for 2008 to 2012, with the achievement gap drawn as a literal bridge between paired groups |
| GradesCube | 39,537 | every tested grade from 2 to 13 per school, as a climbing spiral of arms |
How to read the main scene
A school-year is a four-level hyperglyph, and each level means something different:
| Level | What you see | What it encodes |
|---|---|---|
| 1 | A wireframe sphere on a pin | one school in one year. Its position on the map is the school's real latitude and longitude; its height is the year, two units per year |
| 2 | A thin translucent torus around the sphere | an anchor for the groups below |
| 3 | Six cylinders spaced around the torus | the six student groups: Males, Females, Black, Asian, Hispanic and Caucasian. The size of each is how many students in that group were tested |
| 4 | Octahedra fanning out from each cylinder | up to 25 real tests (the California Standards Tests and the CAPA). The size of each is the mean scale score; the colour is the share of students above proficient, banded from grey for the lowest band up |
Beneath it all is a flat satellite image of San Diego County. Click any glyph for its label, for example Grade: 8 | School: John Muir | Year: 2003, Grade: 8 Group: Males # Subgroup Tested: 107, or Test: CST English-Language Arts MSS: 304 Pct. Prof: 0.
Read it from the outside in. From a distance you see where schools are and how long each has data. Close in, a tree's colours tell you at a glance which groups and which subjects were strong or weak, and big cylinders tell you where the numbers behind the averages were large.
The two companion scenes
Achievement Gap makes the gap between groups a geometric fact instead of a number. Each ethnicity gets two adjacent cylinders, one for economically disadvantaged students and one for the rest, joined by a bridge (a link) whose thickness, colour from green to red, and the angular spread of the pair all follow the gap in English-language-arts scores. Scan up a tree and you watch the gap widen, narrow or close year by year. It starts in 2008 because that is when the district first published these breakdowns. See also SES Achievement Gap Terrain for the same question as a landscape.
Grades Cube swaps the fixed ring of six groups for a spiral: each tested grade level is its own arm climbing the helix, grade 2 innermost and lowest through to grade 13 outermost and highest, in rainbow colours. It uses the all-students figure so that it covers the whole decade, and each school's real span of grades (elementary, middle or high) falls out of the data on its own.
Things to try
- Compare two schools by flying between their trees and looking at the colours of the outer octahedra.
- Slice by year. Trees stack in years, so a horizontal slice through all of them is one year across the district.
- Open the Grades Cube for a different read of the same schools, though it is large (about 40,000 nodes) and wants a moment to load.
How it is built
The generator, generate_calstate_testing.py, is a Python port of an original PHP and MySQL generator for the same visualization, checked field by field against the original's output. It can read either exported CSV files or a live MySQL database, and run_full_dataset.py regenerates the main scene for a chosen range of years. The source database is not shipped; the finished scenes are. Octahedra were chosen over tori for the test branches because tori across tens of thousands of nodes cut the frame rate badly.